Open Access
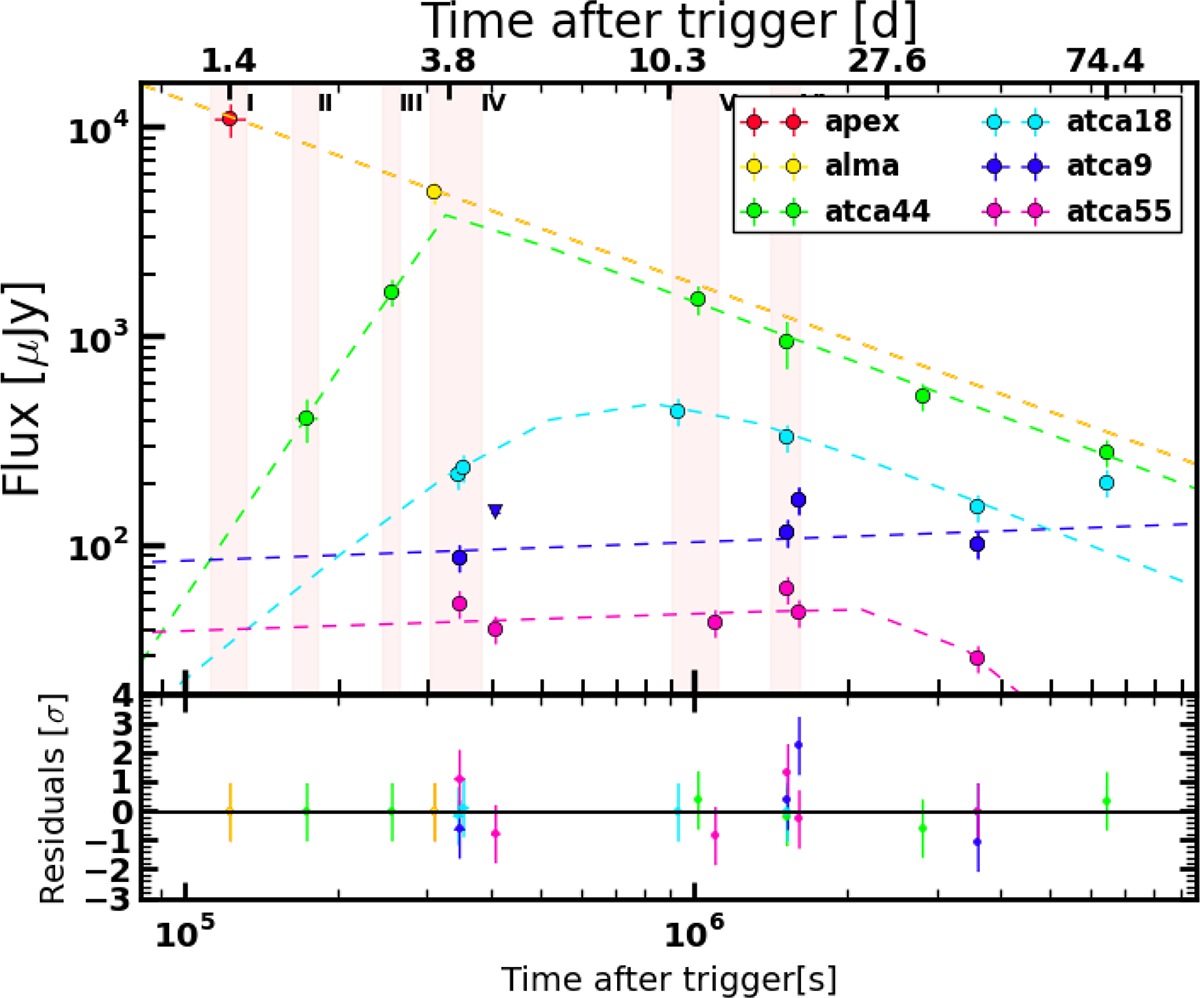
Fig. 9.
Download original image
Sub-millimetre and radio light curves of the GRB 110715A afterglow. The best fit for each of the bands is represented by dashed lines. The six highlighted vertical regions correspond to the epochs used in the broadband multi-epoch SED analysis. The light curves were scaled by an arbitrary factor for clarity.
Current usage metrics show cumulative count of Article Views (full-text article views including HTML views, PDF and ePub downloads, according to the available data) and Abstracts Views on Vision4Press platform.
Data correspond to usage on the plateform after 2015. The current usage metrics is available 48-96 hours after online publication and is updated daily on week days.
Initial download of the metrics may take a while.