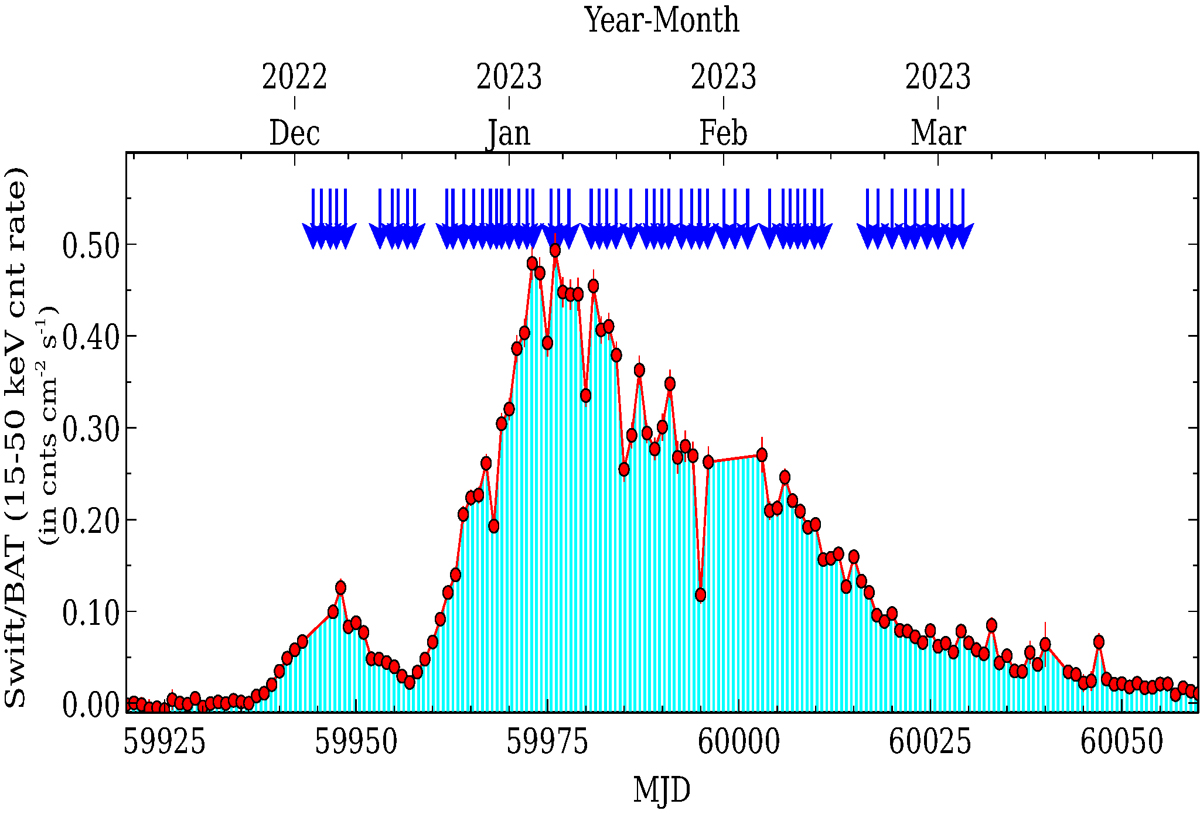
Fig. 1.
Download original image
Long-term Swift/BAT light curve of RX J0440.9+4431 in 15–50 keV covering the 2022–2023 giant outburst duration. The arrows in the insets of the figure represent the start of pointed observations of RX J0440.9+4431 performed with Insight-HXMT. The error bars represent 1σ uncertainties. A log of these pointed observations is shown in Appendix A.1.
Current usage metrics show cumulative count of Article Views (full-text article views including HTML views, PDF and ePub downloads, according to the available data) and Abstracts Views on Vision4Press platform.
Data correspond to usage on the plateform after 2015. The current usage metrics is available 48-96 hours after online publication and is updated daily on week days.
Initial download of the metrics may take a while.