| Issue |
A&A
Volume 701, September 2025
|
|
|---|---|---|
| Article Number | A213 | |
| Number of page(s) | 16 | |
| Section | Astrophysical processes | |
| DOI | https://doi.org/10.1051/0004-6361/202554715 | |
| Published online | 16 September 2025 | |
Insight-HXMT spectral and timing studies of a giant outburst in RX J0440.9+4431
Department of Astronomy, School of Physics and Technology, Wuhan University, Wuhan 430072, PR China
⋆ Corresponding authors: This email address is being protected from spambots. You need JavaScript enabled to view it.
; This email address is being protected from spambots. You need JavaScript enabled to view it.
Received:
24
March
2025
Accepted:
19
July
2025
Abstract
The Be/X-ray binary pulsar RX J0440.9+4431 underwent a giant outburst in late 2022 that lasted three months. Insight-HXMT observed this source at several instances during the outburst in 2022–2023. We used these bright outburst observations of the pulsar to study its X-ray spectral and timing variability. The pulse profiles obtained at similar luminosities during the progress and declining phases of the outburst show a similar shape behavior. With the increase in source luminosity, the complex pulse profile with multiple peaks at low luminosity becomes a single peaked pulse profile at the high luminosity of the outburst peak. The phase-averaged spectra of the pulsar in 1–120 keV are explained with an absorbed cutoff power-law continuum model. During the outburst phases, we found evidence of a cyclotron resonance scattering feature in the spectra that varies in energy (∼33.6 − 41.6 keV) and has a broad linewidth of > 5 keV. In declining phases of the outburst, we also found hints of first cyclotron harmonic varying in 65–75 keV. The application of a thermal and bulk Comptonization model to the phase-averaged and phase-resolved spectra reveals a high surface magnetic field (B ∼ 1013 G) for the pulsar.
Key words: stars: magnetic field / stars: neutron / pulsars: individual: RX J0440.9+4431 / X-rays: binaries
© The Authors 2025
 Open Access article, published by EDP Sciences, under the terms of the Creative Commons Attribution License (https://creativecommons.org/licenses/by/4.0), which permits unrestricted use, distribution, and reproduction in any medium, provided the original work is properly cited.
This article is published in open access under the Subscribe to Open model. This email address is being protected from spambots. You need JavaScript enabled to view it. to support open access publication.
1. Introduction
The Be/X-ray binary RX J0440.9+4431 was first discovered during a ROSAT Galactic plane survey along with its optical companion as LS +44 17/BSD 24-491 (Motch et al. 1997). X-ray pulsations from the source with a period of ∼202.5 s were identified by Reig & Roche (1999). The first evidence of pulsar outburst activity in X-rays was found by Morii et al. (2010) with the MAXI instrument in late March 2010. The peak luminosity of this first outburst in 3–30 keV was 3.9 × 1036 erg s−1 (Usui et al. 2012), suggesting that the source is transient in nature with a relatively high quiescent luminosity, Lx ∼ 1034 erg s−1. The recent distance estimate to the source of  kpc (Bailer-Jones et al. 2021) puts the observed luminosity of the source far below the 1037 erg s−1 typical of Type-I outbursts in Be X-ray binaries (Reig 2011). MAXI/GSC detected a brightening of an X-ray source located at RX J0440.9+4431 11 years after the third outburst (Nakajima et al. 2022). Interestingly, toward the end of this outbreak, its count rate increased again (Pal et al. 2023), reaching a peak X-ray flux of 2.25 Crab (Coley et al. 2023), as was recorded by Swift /BAT (15–50 keV). This unprecedented event allows for the accretion process of RX J0440.9+4431 to be studied across a wider range of luminosities with high-quality data.
The soft X-ray spectrum of RX J0440.9+4431 observed with different X-ray observatories in the past can be explained with a power law plus blackbody components in addition to a 6.4 keV iron line (Usui et al. 2012; La Palombara et al. 2012; Bailer-Jones et al. 2021). In hard X-rays, an absorption feature at ∼30 keV was reported as a possible cyclotron line (Tsygankov et al. 2012). However, there was speculation about the existence of this spectral feature in later studies by Ferrigno et al. (2013). High-quality broadband observations are necessary to confirm the presence or absence of a cyclotron resonance scattering feature (CRSF) in the source. Given the recent re-brightening of the pulsar, Insight-HXMT observations cover many luminosity epochs of the outburst. These can be studied to better understand the pulsar broadband spectrum with physical and empirical continuum models. In the present work, we have used these high-quality broadband observations of the pulsar to study its pulse phase-averaged and phase-resolved spectra.
In this paper, we briefly present our recent results from timing studies and pulse phase-averaged and phase-resolved spectral studies of the pulsar with an empirical continuum model and physics based Comptonization model. In this work, we analyze the observations of this source by Insight-HXMT to characterize its temporal properties, with a focus on the evolution of a pulse profile that is energy- and luminosity-dependent. From the high-energy data that resulted from Insight-HXMT, we can further understand the emission beam pattern of accretion columns in different accretion states.
2. Observations and data reduction
The Insight-HXMT is China’s first space-based X-ray satellite capable of observing X-ray sky in 1–250 keV (Zhang et al. 2020). The three main X-ray instruments on board Insight-HXMT are: the high-energy X-ray telescope (HE, 20–250 keV pointing with effective area ∼5100 cm2) (Liu et al. 2020), the medium-energy X-ray telescope (ME, 8∼35 keV, 952 cm2) (Cao et al. 2020), and the low-energy X-ray telescope (LE, 1∼12 keV, 384 cm2) (Chen et al. 2020).
RX J0440.9+4431 was observed with Insight-HXMT during a giant outburst from late December 2022 to March 2023. Li et al. (2023) used these outburst observations to study its timing properties of the pulsar. The phase-averaged spectral evolution of the pulsar at three different luminosity epochs has been studied (Li et al. 2024a). However, given the many epochs of observations by Insight-HXMT during the giant outburst, it is worth studying its timing properties and spectral evolution using all of the Insight-HXMT observations. In Figure 1, we show the Insight-HXMT pointed observations of RX J0440.9+4431 across the Swift/BAT 15–50 keV long-term light curve covering the outburst duration. The log of these observations is provided in Appendix A.1.
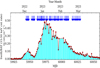 |
Fig. 1. Long-term Swift/BAT light curve of RX J0440.9+4431 in 15–50 keV covering the 2022–2023 giant outburst duration. The arrows in the insets of the figure represent the start of pointed observations of RX J0440.9+4431 performed with Insight-HXMT. The error bars represent 1σ uncertainties. A log of these pointed observations is shown in Appendix A.1. |
To analyze the observations, we used the Insight-HXMT data analysis software package, hxmtsoft-v2.05 to generate the cleaned event files. For the calibration of cleaned event data, we used the caldb v2.06 provided by the instrument team. In order to generate data products such as the spectra and light curves of the pulsar in different energies, we used the following screening criteria to obtain good time intervals (GTIs) with the tasks hegtigen, megtigen, legtigen for the cleaned event files: (1) an elevation angle of > 10°, (2) pointing offset angles of < 0.04°, (3) a geomagnetic cutoff rigidity > 8 GeV and eliminating the time intervals corresponding to the passage of the South Atlantic Anomaly. The screening event tasks hescreen, mescreen, lescreen were used to screen the data. The arrival times of all the screened event data were subjected to the Solar System barycenter correction with the task hxbary. We used the tasks helcgen, melcgen, lelcgen with a bin size of 1/128 s to extract the source and background light curves in different energy ranges. The source spectra were extracted with the tasks hespecgen, mespecgen, lespecgen, respectively, for HE (30–120 keV), ME (10–30 keV), and LE (1–10 keV). The respective background products such as spectra and light curves were estimated using tasks such as hespecbkg, mespecbkg, lespecbkg and helcbkg, melcbkg, lelcbkg, respectively. For the broadband spectral analysis of Insight-HXMT observed spectra of RX J0440.9+4431, we used Xspec v12.11.1 (Arnaud 1996). All uncertainties in the spectral parameters were obtained at a confidence level of 68%.
3. Results
3.1. Timing studies
In order to estimate the spin period of the pulsar from the Insight-HXMT observed light curves, we combined ME light curves in 10–30 keV from all the exposure IDs of a given observation ID. We applied the epoch-folding method (efsesarch task of FTOOLS) to obtain the spin period of the pulsar for each of the observed epochs. We note that our estimates of the pulsar spin period are within the error estimates of the pulsar spin period obtained by Li et al. (2023). Therefore we used these spin period values of the pulsar to construct the pulse profiles in LE (1–10 keV), ME (10–30 keV), and HE (30–150 keV) for each epoch using the epoch-folding FTOOL efold. The folding epoch for each observation was adjusted manually near the start of each observation to obtain two complete pulse profiles. The energy-resolved pulse profiles obtained during the progress and declining phases of the outburst at similar luminosity are compared and shown in Figure 2. It can be seen from Figure 2 that the pulse profiles at low values of the X-ray luminosity are complex and show multiple peaks. However, with the increase in source luminosity the pulse profiles evolve and become single-peaked at the peak of the giant outburst. In hard X-rays (i.e. 30–150 keV), this transition of a multiple-peaked pulse profile at low luminosity to a prominent single-peaked pulse profile occurs at a luminosity value of ∼2.5 × 1037 erg s−1.
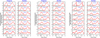 |
Fig. 2. Energy-resolved pulse profiles of RX J0440.9+4431 obtained by folding the light curves from Insight-HXMT LE (1–10 keV) (two panels from left), ME (10–30 keV) (two panels in the middle) and HE (30–150 keV) (two panels from right) light curves at a similar luminosity during the progress and decline of the giant outburst. Two pulses are shown in each panel for clarity. The error bars represent 1σ uncertainties. The epochs of the observations in MJD are shown inside each panel on the left. The corresponding source luminosity estimates in 1–120 keV are shown in the middle of each panel. |
3.1.1. Pulse profiles at similar luminosity
In order to check the luminosity dependence of the pulse profiles, we obtained the pulse profiles of the pulsar in 1–10 keV, 10–30 keV, and 30–150 keV at various luminosity epochs. At a similar luminosity during the progress and decline of the outburst, these pulse profiles were compared. It was found that the hard X-ray pulse profiles 30–150 keV are similar in shape at both the declining and inclining phases of the outburst at similar luminosity epochs. These pulse profiles are shown in Figure 2. However, we observe that the pulse profiles obtained at declining phases of the outburst show an evolution in substructure at the primary peak of the pulse profile. In particular, the ME and HE pulse profiles at a low luminosity (i.e. ∼0.5 × 1037 erg s−1) show two major peaks, respectively, near the 0.1–0.2 pulse phase and 0.7 pulse phase. With the increase in source luminosity, the first peak gradually diminishes in size, leading to the secondary sub-peak as the prominent peak in the pulse profiles at a higher source luminosity.
3.1.2. Pulse fraction variations
To measure the changes in the pulsar intensity during the giant outburst at different luminosities, we computed the pulse fractions (PFs) across the entire outburst in three different energy ranges (i.e. 1–10 keV, 10–30 keV, and 30–150 keV). The PF was defined as: PF = (Imax − Imin)/(Imax − Imin), where Imin and Imax are the minimum and maximum intensity in the pulse profile, respectively. The variation in the PF values across the entire outburst is shown in Figure 3. In Appendix A.1, a complete log of these PF changes of the pulsar is shown. It can be seen from Figure 3(a) that the PF increases gradually as the source luminosity increases. The PF at low energy (1–10 keV) increases from ∼44% at the onset of the outburst (i.e. at MJD 59944.4) to a maximum value of ∼64.2% near the outburst peak (i.e. at MJD 59983.9). Subsequently the low-energy PF decreases to < 27% at MJD 60029.25 with the decline of the outburst. A similar trend is seen in the PF values in ME pulse profiles (i.e. in 10–30 keV). The PF in ME light curves shows an upward trend, from 30.4% at the beginning of the outburst (i.e. at MJD 59944.4) to a maximum value of 58.7% at the outburst peak (i.e. at MJD 59980.7). Subsequently, with the decline of the outburst, it reaches a minimum PF of 20% (at MJD 60029.3). The PF varies in hard X-rays as seen from HE light curves (i.e. in 30–150 keV) from ∼36% at the start of the giant outburst (near MJD 59955.5) to a maximum PF of 71.5% at MJD 59982.8. Thereafter, it gradually decreases to 27.7% at MJD 60010.8 before the outburst fades. We find that, interestingly, the hard X-ray PF further increases during the fading phases of the giant outburst to a maximum of 42% within the Insight-HXMT observations, during which the LE and ME PF values show a decreasing trend with the decline of the outburst.
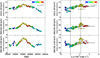 |
Fig. 3. Left: (a) Variation in PFs in RX J0440.9+4431 during the 2022–2023 giant outburst in the energy ranges of 1–10 keV, 10–30 keV, and 30–150 keV obtained, respectively, from the LE, ME, and HE light curves. Right: (b) Variation in PF is shown with the outburst source luminosity in 1–120 keV in RX J0440.9+4431 during the 2022–2023 giant outburst in the energy ranges of 1–10 keV, 10–30 keV and 30–150 keV obtained, respectively, from the LE, ME and HE light curves. Table A.1 in the appendix shows the values of these PF estimates and the respective epochs of the giant outburst. The color bar represents the 1–120 keV source luminosity in units of 1037 erg s−1. The two vertical dashed lines at Lx ∼ 1 × 1037 erg s−1 and Lx ∼ 2.2 × 1037 erg s−1 represent the turnover points in the variation of PF with outburst luminosity. |
In Figure 3(b), we show the variation in PF with source luminosity, in the energy ranges 1–10 keV, 10–30 keV and 30–150 keV obtained respectively, from LE, ME and HE pulse profiles. In particular, in hard X-rays (i.e. in 30–150 keV) we see a turnover of PF variation with luminosity twice. The first turnover is at Lx ∼ 1 × 1037 erg s−1 and the second turnover is seen near Lx ∼ 2.1 × 1037 erg s−1. The variation in PF shows a clear dependence on the X-ray luminosity. Previously, Li et al. (2023) have reported a transitional luminosity of ∼2 × 1037 erg s−1 from their study of PF variations in 30–100 keV pulse profiles. In the present work, we have used the HE pulse profiles in 30–150 keV and found that there exists another turnover point at Lx ∼ 1 × 1037 erg s−1 at which the PF variation changes from a negative trend at lower luminosity to positive variations with Lx up to ∼2.1 × 1037 erg s−1 (see Fig. 3(b)). With a further increase in source luminosity (i.e. Lx > 2.1 × 1037 erg s−1), we see a slight decline in the PF variation. Within these two transitional luminosities, we find the PF values in every energy range show a positive dependence on luminosity. Interestingly, in Figure 2 we observe that, at the transitional luminosity, Lx ≤ 1 × 1037 erg s−1, the HE pulse profiles are multi-peaked. The two prominent peaks are located near pulse phases 0.1–0.2 and 0.6–0.7. With the increase in luminosity, the first peak becomes less prominent and diminishes in size. However, the second prominent peak splits in two at Lx ≥ 2.4 × 1037 erg s−1. At the outburst peak, with the net decrease in luminosity we see that the pulse profiles evolve to a single peak.
3.2. Spectral studies
3.2.1. Phase-averaged spectroscopy
The 2023 Type-II outburst in RX J0440.9+4431 was observed by Insight-HXMT at multiple luminosity epochs of the pulsar, covering the progress, decline, and peak outburst phases of the pulsar emission. These observations provide the broadband X-ray spectra of the pulsar in 1–120 keV to study the variable spectrum of the pulsar. Li et al. (2024a) studied the pulsar spectrum during a high- and low-luminosity state of the pulsar using two Insight-HXMT observations (i.e. ObsIDs P0514361040 and P0514361005, respectively). In the present work, we have studied the pulsar broadband spectrum as it evolved throughout the giant outburst covering many luminosity epochs. We performed a combined spectral analysis of the LE, ME, and HE data from 2–120 keV for each of the Insight-HXMT observations. The LE spectra from all exposure-IDs pertaining to a single observation ID were combined together with addascaspec FTOOLS. This has resulted in a higher effective exposure for each observation used for phase-averaged spectral analysis (Table A.1). A similar procedure was carried out for ME and HE spectra. We used the LE spectra in 2–10 keV, ME spectra in 10–30 keV, and the HE spectra in 30–120 keV for the broadband spectral analysis. At first, we considered the commonly used phenomenological continuum models to describe the high-energy spectra of X-ray pulsars. These are, namely: (a) a cutoff power law (cutoffpl) model, (b) a power-law model with an exponential cutoff at high energy (powerlaw*highecut), and (c) a combination of two power laws with a negative and positive spectral index with an exponential cutoff in energy (NPEX) (Mihara et al. 1995). To account for the Galactic interstellar absorption along the line of sight, we applied the TBabs absorption model component to these continuum models with the elemental abundances set to wilm (Wilms et al. 2000) and cross sections set to vern (Verner et al. 1996). We let the hydrogen column density NH vary freely during spectral fitting. However, we note that the Galactic H I density in the direction of the RX J0440.9+4431 is ∼0.6 × 1022 cm−2 (HI4PI Collaboration 2016).
We performed pulse phase-averaged spectral studies of the pulsar with different spectral continuum models as was stated above in combination with a soft blackbody component, such as (1) cutoffpl + bbody, (2) highecut + bbody, or (3) NPEX + bbody. We found that a cutoff power law model with a blackbody component (cutoffpl + bbody) fits the phase-averaged spectra well in all epochs of the source luminosity. In addition to using the soft blackbody component at kTBB1 ∼ 0.3 keV to better fit the low-energy spectra in most of the observations, we also used another additional blackbody component of kTBB2 ∼ 2.5 keV during the declining part of the outburst to explain the broadband spectra. Apart from these two additional blackbody components, we also included a Gaussian component near 6.4 keV to account for neutral and fluorescence Fe Kα line emission. The presence of 6.4 keV line in the outburst spectra has also been noted based on NICER observations (Mandal et al. 2023). In hard X-rays near 30–40 keV, we find a broad absorption feature in the spectra, regardless of the model combination used as described above. The spectral residuals seen at these energies with the above model combinations are shown in Figure 4 (i.e. see panels b,c,d) considering the example of phase-averaged spectra of Insight-HXMT observation ID P0514361051. This is explained by an absorption component: cyclabs (in Xspec), thought to be a CRSF (Staubert et al. 2019), seen sometimes in the spectra of bright X-ray pulsars. The expression for the cyclabs model in Xspec is
 (1)
(1)
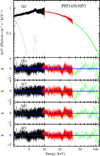 |
Fig. 4. Unfolded phase averaged spectra along with best-fitting continuum model shown in the figure in inset (a). We show the spectral residuals obtained with various phenomenological models such as: (b) an absorbed cutoffpl model, (c) an absorbed power law model with a high-energy exponential cutoff, (d) an absorbed two component power law model with a negative and positive exponential cutoff, (e) the best-fitting absorbed cutoff power law model with a cyclotron absorption line component in hard X-rays. The absorption feature in hard X-rays is fit with a multiplicative cyclotron line absorption component (cyclabs in Xspec). The error bars represent 1σ uncertainties. In the inset (a), the observation ID is shown on the right side of the panel. Corresponding epochs of the Insight-HXMT observations can be seen from Table A.1 in the appendix. |
where the cyclotron line central energy, width, and depth are denoted as Ecycl, σcycl, and τcycl, respectively (Mihara et al. 1990).
The presence of a cyclotron line in the spectra near ∼30 keV was previously reported in Tsygankov et al. (2012) during a low-luminosity state of the pulsar. Recently, however, Salganik et al. (2023) used two-component models such as bbodyrad + cutoffpl and compTT + compTT to explain the NuStarobserved broadband spectra of RX J0440.9+4431 in a bright state without the need to include CRSF near 30 keV. Apart from the detection of a fundamental cyclotron line near ∼30 keV, we have also detected a first harmonic of the cyclotron line varying in energy ∼64.6 − 75.3 keV of the broadband spectra near the peak and declining phases of the outburst. However, it can be seen from the Figure 5 that although the line widths of these cyclotron lines are quite wide (i.e., σcycl1 > 5 keV, σcycl2 > 5 keV in most of the observed epochs during the giant outburst), the line depth values, τcycl1 and τcycl2, are shallow (i.e. < 0.5), signifying the weak detection of these lines.
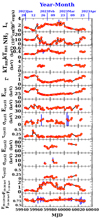 |
Fig. 5. Variation in spectral parameters of RX J0440.9+4431 at various luminosity epochs of the giant outburst. An absorbed cutoff power-law model (i.e. cutoffpl) with additional components such as (1) a Gaussian component at 6.4 keV, (2) a cyclotron absorption component varying in 33.6–41.6 keV, (3) a soft blackbody component near 0.3 keV, and sometimes a second blackbody component near 2.5 keV, was used to obtain the best-fitted continuum model. |
For all of the Insight-HXMT observations of RX J0440.9+4431 covering the entire giant outburst (Figure 1), we performed the phase-averaged spectral analysis with the best-fitting cutoffpl + bbody model along with the additional model components. The variation in the spectral parameters with source X-ray luminosity is shown in Figure 5. The unfolded phase-averaged spectra obtained with the best-fitting continuum models and their respective residuals are shown in Figure 4. It can be seen from Figure 5 that the low-temperature blackbody component, kTBB1, varies in the range 0.24–0.55 keV, and the high-temperature blackbody component, kTBB2, varies in the range of 1.9–2.7 keV. The second blackbody component is seen at a source luminosity of ≤2 × 1037 erg s−1. During the declining phase of the giant outburst, we find the presence of the high-temperature blackbody component to vary between 2–2.7 keV, while the soft blackbody component is absent in the spectral continuum. The variation in the power-law photon index (Γ) shows a negative trend, with an increase in source luminosity up to ≤2 × 1037 erg s−1, whereas with a further increase in source luminosity, Γ shows a positive trend up to the maximum source luminosity as was seen during the giant outburst. From the variation in cutoff energy (Ecut) with source luminosity we see a similar variation as was seen in case of Γ. For a luminosity ≤2 × 1037 erg s−1, the variation in Ecut shows a decreasing trend from a maximum value of 47.5 keV at a low source luminosity of (0.46 ± 0.10)×1037 erg s−1 to a minimum cutoff energy, Ecut, value of 17.6 keV near the outburst peak luminosity of (2.29 ± 0.02)×1037 erg s−1. However, with a further increase in luminosity, as is shown in Figure B.1, we see a positive trend of Ecut with Lx > 2 × 1037 erg s−1.
In Figure 5, we also show the variation in two flux ratios with the progress of the giant outburst. We define the first flux ratio in soft X-rays (i.e. HR1) as the ratio of the X-ray flux in 10–30 keV to that of the X-ray flux in 1–10 keV, and the second flux ratio in hard X-rays (HR2) as the ratio of the flux in 30–120 keV to that of the flux in 10–30 keV. Interestingly, we find that HR1 increases with source luminosity during the progress of the outburst. However, at the outburst peak (i.e. between MJDs 59976.5–60001.1), as can be seen from Figure 5, we see a decline of HR1 with an increase in source luminosity. However, beyond MJD 60001.1, as the outburst was declining, we find that HR1 shows a decreasing trend with a decrease in source luminosity. We note that the onset of the decline in HR1 values occurred when the luminosity was (2.29 ± 0.02) × 1037 erg s−1. The source outburst luminosity during the dip of HR1 variation at the outburst peak is ≥2 × 1037 erg s−1. In the variation of HR2 with outburst luminosity and throughout the outburst duration, we do not observe any such abrupt changes. Rather, the HR2 values vary within 0.72–0.95, mostly showing no significant variation either with the outburst luminosity or with the progress of the giant outburst.
3.2.2. Phase-resolved spectroscopy
The interesting variation in phase-averaged spectral parameters with source outburst luminosity prompted us to explore further the spectral parameter variations with pulse phases of the pulsar. For this, we carried out pulse-phase-resolved spectral studies at three different luminosity epochs of the pulsar. Two of the phase-resolved studies were performed at a similar luminosity of (1.22 ± 0.09)×1037 erg s−1 and (1.24 ± 0.05)×1037 erg s−1 in 1–120 keV, respectively, during the progress (i.e. at MJD 59965.37 with ObsID: P0514361025) and declining phase (i.e. at MJD 60005.77 with ObsID: P0514361057). The pulsar spectra at these epochs were divided into ten pulse-phase bins. Spectra from LE, ME, and HE for each pulse-phase bin were fit simultaneously with the best-fitting spectral model for these observations obtained during the phase-averaged spectral studies. The third phase-resolved spectral study was performed for the pulsar observation taken at the peak of the giant outburst (i.e. near MJD 59977.8 with ObsID: P0514361038) where the net luminosity of the pulsar was noted to be (2.21 ± 0.02) × 1037 erg s−1. The pulsar spectra at this epoch obtained from HE, ME, and LE detectors were divided into 20 pulse-phase bins.
For the phase-resolved spectral fit of the ObsID: P0514361025, we used the best-fitting absorbed cutoffpl model with two blackbody components (with kTBB1 ∼ 0.4 keV and kTBB2 ∼ 2.6 keV), a Gaussian component at ∼6.4 keV, and a cyclotron absorption line component (Ecycl ∼ 38.85 keV). For the phase-resolved spectral studies at the peak of the giant outburst, we considered spectra from ObsID P0514361038. The best-fit phase averaged spectral continuum for this epoch is an absorbed cutoffpl continuum model with a soft blackbody component at ∼0.55 keV and two cyclotron line components with line energies at ∼35.3 keV and 64.6 keV, respectively. In the declining phase of the giant outburst, we carried out pulse-phase-resolved spectral studies from the Insight-HXMT observation that has ObsID P0514361057, for which the best-fit phase averaged spectral model consists of an absorbed cutoffpl model with a single blackbody component at 2.7 keV and a cyclotron absorption line component at energy ∼36.7 keV. In Figure 6 we show the spectral parameter variations obtained with pulse phases during these three luminosity epochs along with the pulse profiles in energy bands 1–10 keV, 10–30 keV, and 30–150 keV.
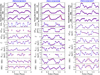 |
Fig. 6. Variation in spectral parameters with pulse phases at three luminosity epochs of the pulsar using an absorbed cutoff power law (i.e. cutoffpl) model along with blackbody components. The absorption feature in hard X-rays was fit with a cyclotron line absorption component (cyclabs). The error bars represent 1σ uncertainties. The observation IDs are shown on the top of each panel. Corresponding epochs of the Insight-HXMT observations can be seen from Table A.1 in the appendix. |
In ObsID: P0514361025, the soft blackbody emission component (i.e. kTBB1) varies within (0.26–0.30) keV over pulse phases (Figure 6) and it is not seen at the peak phases of pulse profile (i.e. in 0.4–0.7 pulse-phase bin). However, the second blackbody component (i.e. kTBB2) is seen across all pulse-phase bins and varies within (2.16–3.2) keV. The variation in kTBB2is found to be in phase with the LE and ME pulse profiles. The CRSF at  keV in the phase-averaged spectra is found to vary in (36.9–41.2) keV over pulse phases of the pulsar except in the peak pulse phases, where it is absent in the broadband pulsar spectra. In case of the phase-resolved spectra of ObsID: P0514361038 (at outburst peak), we found the pulse profiles to be single-peaked and to evolve with energy. The column density NH is marginally high at pulse phases 0.2–0.6 compared to the Galactic column density in the source direction. During these pulse phases of high intensity, kTBB1 varies at lower values of ∼0.35 keV, while in the low-intensity phases kTBB1 increases to higher values of ∼0.8 keV. In other words, the variation in kTBB1 remains out of sync with the pulse profile. Similar out-of-phase variation with pulse profiles is seen in the case of HR1 variation with pulse phases. However, the variation in Ecut and Γ with pulse phases was found to be similar and in phase with the pulse-profile variations. The maximum value of Ecut is 22.97 keV and Γ is 1.63 at the maximum intensity of the pulse profiles, whereas the minimum values of Ecut ∼ 14.34 and Γ ∼ 0.11 are seen at 0.775 ± 0.025 pulse phase where the HE, ME, and LE pulse profiles are also seen to be at low-intensity phases. Interestingly, we found the presence of double cyclotron lines in the pulsar phase-resolved spectra that vary with pulse phases. The first CRSF feature was found at Ecycl − 1 = 35.3 ± 0.4 keV in the phase-averaged spectra with σcycl − 1 = 10.6 ± 0.7 keV and a line depth of δcycl − 1 = 0.10 ± 0.01, which varies with pulse phases, with Ecycl − 1 ∼ (28.05–41.21) keV. The second cyclotron line component was found to vary from (51.77–80.96) keV. Moreover, it is observed in 0.2–0.7 pulse phases, while it is undetected during the minimum intensities phases of the pulse profiles. During the giant outburst peak of the pulsar, the variations in cyclotron line energies show a strong pulse-phase dependence.
In order to check the pulse-phase dependence of spectral parameters during the decline of the giant outburst and any similarities in the spectral properties observed during the progress of the giant outburst, we performed phase-resolved spectral studies of the pulsar from the broadband spectra obtained from the Insight-HXMT ObsID: P0514361057. We note that the 1–120 keV unabsorbed flux (and hence luminosity) of the pulsar obtained during the progress of the outburst (ObsID: P0514361025) and during the decline of the outburst (ObsID: P0514361057) are similar. Therefore it is interesting to check the spectral parameter variations during the decline phase of the outburst from the pulse-phase resolved spectral studies of Insight-HXMT observation with ObsID: P0514361057. During this observation, the soft blackbody component kTBB1, which varied with pulse phases during the progress and at the peak of the giant outburst, was not needed in the broadband spectral fitting with the empirical cutoffpl model. However, a high-temperature blackbody component, kTBB2, was required in the phase-resolved spectral fit, and it was found to vary with pulse phases of the pulsar in the energies (1.95–3.23) keV. The power-law spectral index, Γ, also varies with pulse phases in the range (0.39–0.89), which is higher at high-intensity phases of the pulse profiles and vice versa. The cutoff energy (Ecut) was also found to vary with pulse phases similarly in the range of 20.24–27.72 keV, which is low at low-intensity pulse phases and reaches higher values at pulse phases where pulse profiles show maximum intensity. The cyclotron line energy (Ecycl − 1) was seen to vary with pulse phases in the range (33.34–43.24) that are marginally higher at the primary and secondary sub-peaks (i.e. in 0.4–0.5 and 0.8–0.9 pulse phases) of the pulse profiles. The variations in HR1 and HR2 values across pulse phases show similar patterns of variability; that is, they are lower at high-intensity phases of the pulse profiles and vice versa.
3.3. Results from the Comptonization model
In the previous sections, 3.2.1 and 3.2.2, the strong variability of the pulsar spectrum has been explained with a phenomenological model. However, it lacks a complete physical description of the pulsar accretion column emission during the bright outburst. Given that the pulsar was observed with Insight-HXMT over large luminosity ranges, it is imperative to seek a physical description of the accretion column emission of the pulsar using these observations. Therefore we used a physics-based Comptonization model (Becker & Wolff 2007) to explain the pulsar spectra at its broad luminosity epochs. The Comptonization model (i.e. hereafter BW07 model) could explain the pulsar accretion column emission spectra considering energization of the thermal and bulk Comptonization of seed photons. In it, it is assumed that the seed photons produced in the cylindrical accretion column are primarily due to the bremsstrahlung, cyclotron, and blackbody emission processes in the accretion plasma (Becker & Wolff 2007, 2022). The BW07 model has been useful in explaining the spectra of bright and highly magnetized X-ray pulsars, such as 4U 0115+63 (Ferrigno et al. 2009), EXO 2030+375 (Epili et al. 2017; Yang et al. 2024), Her X-1 (Wolff et al. 2016; Becker & Wolff 2007), and Cen X-3 and LMC X-4 (Becker & Wolff 2007). The Xspec incorporation of this model (as bwcycl) and its usage was illustrated in Ferrigno et al. (2009). Among the BW model parameters, we fixed the mass and radius of the neutron star (i.e. MNS = 1.4 M⊙ and RNS = 10 R⊙), and the distance was fixed at values of 2.44 kpc (Bailer-Jones et al. 2021). The remaining free parameters of the model are: (1) the mass accretion rate (ṁ), (2) the electron temperature, Te, (3) the column radius, r0, (4) the strength of the NS magnetic field, B12, in units of 1012 G, (5) the dimensionless photon diffusion parameter, ξ, and (6) the Comptonization parameter, δ. Among these, the parameter ξ signifies the relative importance of the timescale for the radiation to diffuse through accretion column walls to the dynamical timescale for the gas to accrete onto the NS. It was defined in equation (26) of Becker & Wolff (2007) as
 (2)
(2)
where mp denotes the proton mass, c is the speed of light, and σ∥ and σ⊥ represent the mean scattering cross section for photons propagating parallel and perpendicular to the magnetic field, respectively. The ratio of corresponding Compton parameters, y, for the bulk and thermal Comptonization, δ, is expressed as (see Equation (98) of Becker & Wolff 2007)
 (3)
(3)
Among the other free parameters, during the spectral fitting procedure we constrained the mass accretion rate, ṁ, by assuming that the total energy integrated luminosity, Lx, of the emergent spectrum of the pulsar is equal to the net accretion luminosity,  , of the pulsar observed in 1–120 keV. We used the phase-averaged best-fit empirical cutoffpl model along with the additional components, as is described in Section 3.2.1, to estimate the flux in 1–120 keV (see Appendix A.1). The mass accretion rate (ṁ) strongly correlated with r0, then after obtaining a best fit with the BW07 model we froze the parameter values of r0 and ṁ as was suggested in Ferrigno et al. (2009). This ensured a stable fit for other model parameters such as B12, Te, ξ, and δ. The absorption model component, TBabs , was used with the scattering cross sections set to vern and abundances set to wilm (Wilms et al. 2000), to account for the Galactic absorption in the direction of RX J0440.9+4431. To better fit the spectra at low energy X-rays, we required a soft blackbody component bbody of temperature kTBB1, a Gaussian component at ∼6.4 keV. A high-temperature second blackbody component of temperature kTBB2was also required while fitting the pulsar spectra observed during the progress and declining phases of the giant outburst (similar to cutoffpl model in Section 3.2.1). For the other additional model components of the BW model, in hard X-rays we used an absorption component (namely, cyclabs) to include CRSFs seen in the spectra. The line energy of the CRSF component was found to vary by ∼32.1–47.6 keV during the outburst. The line width of this feature was fixed to 5 keV as it could not be constrained during the spectral fit. Apart from this absorption feature, during the peak and declining phases of the giant outburst (i.e. MJD: 59973.11–59994.87) we found a second absorption feature in hard X-rays. Therefore we used another cyclabs component in the broadband spectral fitting for these observations. The energy of the second CRSF component was found to be (63.8–77.7) keV. In Figure 7, we show the unfolded phase-averaged spectra of three Insight-HXMT observations (i.e. from ObsdID(s): P0514361025, P0514361038, and P0514361057) with the best-fitting model and residuals. The physical parameter variation in the best-fit BW07 model obtained across the giant outburst at 37 different luminosity epochs of the pulsar RX J0440.9+4431 is shown in Figure 8.
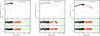 |
Fig. 7. (a): Unfolded spectra of RX J0440.9+4431 in 2–120 keV obtained from three example observations during the late 2022–2023 giant outburst. The spectrum in the left was obtained from ObsID: P0514361025 (near MJD 59965.37) before the outburst peak. The spectrum shown in the middle was obtained from the ObsID: P0514361038, taken at the peak of the outburst (MJD: 59977.804). The spectrum shown on the right side was obtained from the declining phase of the giant outburst at MJD 600005.769 (ObsID: P0514361057). The spectral residuals shown in the panels (b) in each figure were obtained from the BW model without any cyclotron line component, whereas the residuals shown in panels (c) are for the best-fitting BW model that required a cyclotron line component (in all of the three mentioned observations) and a second cyclotron line component (for the ObsID: P0514361038) in hard X-rays. A Gaussian component near 6.4 keV was added to the spectra to account for the emission from neutral Fe Kα line near the pulsar in RX J0440.9+4431. |
Using the BW model we could estimate the pulsar magnetic field (i.e. B12 in units of 1012 G) of the pulsar as an independent parameter. Throughout the outburst, we found that the estimated pulsar magnetic field is very high and varies in the range ( ∼ 4.8 − 15.4)×1012 G. During the bright phases of the outburst (i.e. at Lx ≥ 2 × 1037 erg s−1), B12 < 10, whereas during the declining phases, as the net X-ray luminosity of the pulsar decreases to lesser values than 2 × 1037 erg s−1 down to ∼0.37 × 1037 erg s−1, we find a higher estimate of the NS magnetic field reaching (15.3 ± 1.4)×1012 G (Figure 8). The mass accretion rate, ṁ17 (i.e. ṁ in units of 1017 g s−1), during the outburst varies in the range ( ∼ 0.25 − 1.51), reaching higher values with an increase in source luminosity. At the outburst epoch MJD:59994.86, the pulsar in RX J0440.9+4431 accretes at a maximum rate of ṁ17,max ∼ 1.51. However, it is reduced to lower values of ∼0.29 during the declining phase of the outburst at MJD: 60021.773. The temperature of the additional soft blackbody component, kTBB1, in the range of ( ∼ 0.26 − 0.50) keV increases with the source luminosity. Noticeably, near the peak episodes we see an abrupt decline in the kTBB1 values to 0.29 ± 0.01 keV, which later increases to 0.36 keV before further decreasing to lower values of 0.28 ± 0.02 as the outburst declines beyond MJD 60017. Similar to the variations seen with the empirical best-fit cutoffpl model, in explaining the phase-averaged spectra (i.e. as in Section 3.2.1), we also see an evolution of an additional high-temperature blackbody component (of temperature kTBB2) along with BW model parameters. The second bbody component was required in the spectral fitting during the progress of outburst (i.e. during MJD: 59962.65–59973.11) increasing in energy, kTBB2(2.45–5.97) keV, and during the declining phase of the outburst (i.e. during MJD: 60001.14–60029.25) with a decreasing trend in kTBB2from (3.17–2.53) keV. We find that, the second bbody component was not needed during the outburst peak episodes, similar to the results seen from the empirical best-fit model to the phase-averaged outburst spectra of RX J0440.9+4431.
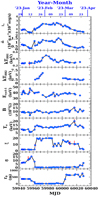 |
Fig. 8. Best-fitting phase-averaged spectral parameters using the bwcycl model obtained at different epochs of the giant outburst in RX J0440.9+4431 observed with Insight-HXMT. The error bars represent 1σ uncertainties. |
In hard X-rays above 30 keV, we used an absorption component, namely cyclabs, to account for the CRSF seen in the spectra varying in energy, Ecycl1: (32.08–47.56) keV, with the outburst epochs of the pulsar and showing no particular dependence on outburst source luminosity. However, as can be seen from Figure B.2, between the source outburst luminosity, (1 − 2)×1037 erg s−1, Ecycl1 is negatively correlated with the net source X-ray flux (or luminosity). Apart from the first cyclotron line component, Ecycl1, we also detected a second cyclotron line component in hard X-rays during the spectral fit with the BW model to the broadband spectra obtained from declining phases of the giant outburst (i.e. during MJD 59973.11–60009.87). The line energy of this second CRSF component varies by ∼63.8 − 77.7 keV. The line depth of the first CRSF was found to vary by 0.05–0.29 during the entire outburst, signifying the weak detection of this absorption feature, whereas the line width during most epochs was fixed at 5 keV to obtain better constraints on the error estimates of other spectral parameters.
Among the other BW07 model parameters, the plasma temperature (kTe), in other words the temperature of the electrons in the optically thin regions above the thermal mound of NS, varies greatly, reaching higher values of 20 keV during the declining phases and Te ∼ 5.7 keV during the initial phases. The average plasma temperature during the outburst peak episodes (between MJD:59961–60010) remains at values < 13 keV. This shows that there is a substantial cooling of plasma seen at the high-source-luminosity phases of the outburst. This is also evident from the variations in Te versus Lx, as is shown in Figure B.2. Such a scenario may occur near pulsar accretion column, when pulsar emission is close to its “critical luminosity” regime. During this, there can be a change in the emission beam pattern of the pulsar from a pure pencil beam pattern at low X-ray luminosities to a mixture of a pencil beam and a fan-beam emission pattern. Therefore the hard X-ray photons escape the accretion column through side walls, leading to a decrease in the accretion plasma temperature near the emission regime of critical luminosity. This has been further strengthened from the variation in the dimensionless parameter, ξ, with Lx during the peak of the giant outburst. As was defined in Equation (2), the parameter ξ shows the relative importance of the timescale for the photons to escape through the accretion column walls to the dynamical scale for the accretion of the gas onto the NS.
The parameter ξ, in terms of the accretion column height is expressed in Equation (109) of Becker & Wolff (2007) as a ratio of the “trapping altitude” (ztrap) for the photons to diffuse vertically in the accretion column to the distance from the NS surface to the sonic point, zsp:  . From the variation in ξ with luminosity, we find that higher values of ξ > 10 indicate higher values of trapping altitudes compared to zsp, leading to photon penetration into the higher regions above the sonic point in the accretion column. From the variation in the δ parameter with the progress of the outburst, we find that it varies at its lower values within ≤1 throughout the giant outburst. However, during the onset and declining phases of outburst when the accretion luminosity is Lx < 1, the δ is seen at values of ≫1. As per Equation (3), this implies that it is the thermal Comptonization that is the dominant mechanism in shaping the pulsar accretion column emission, whereby the photon energization proceeds through thermal scattering of plasma electrons. The size of the column emission region (r0) during the outburst peak episodes (i.e. between MJD: 59962–60001) was found to be < 50 m, indicating that most of the Comptonized column emission is seen from the base of the accretion column. However, with the decline in the outburst, the column emission size rises to higher values (i.e. r0 > 500 m), implying that the net Comptonized emission is seen at higher heights of the accretion column, with the bulk Comptonization becoming the leading mechanism (i.e. due to an increase in δ) in energizing the X-ray photons. We have also studied the phase-resolved spectra of the pulsar using the BW model at three luminosity epochs, which is elaborated in Appendix C.
4. Discussions
4.1. Spin period variations
The 2022–2023 giant X-ray outburst of Be/X-ray binary (BeXB) pulsar in RX J0440.9+4431 has been extensively observed by Insight-HXMT spanning several observation epochs during MJDs 59944–60029. The net X-ray luminosity of the pulsar in 1–120 keV during the outburst spans two orders of magnitude. It was found to be in the range of 4.5 × 1036 erg s−1–2.8×1037 erg s−1, where the distance to the source is considered to be 2.44 kpc (Bailer-Jones et al. 2021). However, from earlier observations during periods of low X-ray activity it was reported that the net luminosity of the pulsar could reach lower levels of 1034 − 1035 erg s−1 (La Palombara et al. 2012; Reig & Roche 1999). A significant spin-up of the pulsar was observed during the outburst in 2022–23, as is noted by Li et al. (2023), from the measured spin-period of the pulsar in (30–100) keV with Insight-HXMT and in (2–10) keV with NICER. From the measured spin period of the pulsar in (10–30) keV during the outburst using ME light curves, we find it to be spinning up from (208.03 ± 1.48) s at the start of the outburst (near MJD 59944.40) to (204.80 ± 0.19) s near MJD 60029.28 as the outburst declines. The average spin-up rate of the pulsar during its giant 2022–2023 outburst is found to be  s s−1. The present spin-up of the pulsar is higher by two orders of magnitude than the average spin-down rate of
  s s−1 seen during the last decade (La Palombara et al. 2012).
4.2. Pulse profiles at similar luminosities and absorption dips
In this paper, we have studied the variation in pulse profiles and PFs across many epochs of the giant outburst. The pulse profiles of the pulsar have been found to be highly variable with energy and source luminosity. The energy dependence of the pulse profiles in RX J0440.9+4431 during the outburst has been reported previously (Sharma et al. 2024; Li et al. 2023; Mandal et al. 2023; Salganik et al. 2023) from AstroSat, Insight-HXMT, NuStar, and NICERobservations at different luminosity epochs of the pulsar. In this work, we have compared the pulse profiles in three energy ranges obtained at a similar source luminosity with Insight-HXMT during the rising and declining phases of the outburst (see Figure 2). We find that the pulse profiles in hard X-rays (30–150 keV) show a similar structure and shape at similar values of the source luminosity.
During the declining phases of the outburst, the pulse profiles at low (1–10 keV) and medium (10–30 keV) energies evolve to be multi-peaked, with the appearance of sub-pulses before and after the main peak. This is seen in the LE and ME pulse profiles at luminosities of ≥2 × 1037 erg s−1. The appearance of such sub-pulses has also been reported previously at source luminosities of ∼6 × 1036 erg s−1 (i.e. scaled to the recent distance estimate of 2.44 kpc) (Tsygankov et al. 2012). At the outburst peak luminosity, we find that the LE and HE pulse profiles become sinusoidal and single-peaked. The other prominent feature in the pulse profiles of RX J0440.9+4431 is the appearance of a sharp absorption-dip-like structure at certain pulse phases of the pulsar. It was first reported in Usui et al. (2012) in low-energy pulse profiles obtained from RXTE/PCA observations during an outburst of the source in 2010. However, during low-luminosity states of the pulsar, such dip features are not seen in the pulse profiles (Tsygankov et al. 2012). This suggests some luminosity dependence of the dip structure seen in the profiles. In our present study, we find the dip structure in the low-energy, LE (1–10 keV) pulse profiles at 0.7 pulse phases during the declining phases of the outburst. The dip structure is found to be absent during the rising phases of the outburst at similar luminosities, as is shown in Figure 2. It is seen up to a source luminosity of 2.48 × 1037 erg s−1. However, during the outburst peak we find the LE pulse profiles to be single-peaked with an absence of any dip structures. Instead two sub-pulses before and after the main peak become apparent. Previously, Tsygankov et al. (2012) reported the appearance of sub-pulses around the main peak in 3–8 keV, 8–14 keV pulse profiles in a low luminosity state (Lx ∼ 1.5 × 1036 erg s−1) and the presence of an absorption dip structure after the 0.25 phase of the main peak in pulse profiles below 8 keV in a high-luminosity state (i.e. Lx ∼ 8 × 1036 erg s−1). Our timing studies of the pulsar in RX J0440.9+4431 show that the shape of the pulse profiles remains similar at similar values of the source luminosity. This further strengthens fact that the pulse profiles are strongly luminosity-dependent. The structure of the pulsar emission column remains robust during the giant outburst. Although the giant outbursts in X-ray pulsars remain aperiodic and unpredictable, the strong luminosity dependence of the pulsar clearly shows that the structure of the accretion column remains unaffected with respect to different outbursts. Another such pulsar that has shown in the past such a strong luminosity dependence in the pulse profiles is EXO 2030+375 (Epili et al. 2017).
4.3. Spectral variability
To understand the spectral variability during the bright phases of the pulsar emission, we used an empirical continuum model, such as an absorbed cutoffpl model along with additional model components. To obtain a physical description of the accretion column emission in RX J0440.9+4431, we applied a self-consistent bulk and thermal Comptonization model (Becker & Wolff 2007) to all the Insight-HXMT observed epochs of the outburst spectra. This uniquely addresses the changes in the accretion plasma temperature and the scattering cross sections for the photons propagating parallel and perpendicular to the NS magnetic field. Be/X-ray binaries are generally thought to be transient X-ray binary systems characterized by two types of outburst activity (Reig 2011). The peak luminosity during the periodic Type-I outburst reaches < 1037 erg s−1, whereas during the aperiodic major Type-II outburst the source X-ray flux could reach 103 − 104 times the flux levels seen during quiescence (i.e. it could reach luminosities in the range of 1037 − 1038 erg s−1). The peak luminosity during Type-II outbursts in BeXBs sometimes exceeds the critical luminosity emission of the pulsar, making the pulsars super-critical. Some of the X-ray pulsars reaching a super-critical state of accretion are: EXO 2030+375 (Epili et al. 2017; Yang et al. 2024), GRO J1750-27 (Malacaria et al. 2023), and RX J0440.9+4431 (Salganik et al. 2023). From the NICER observation of the giant 2022–2023 outburst in RX J0440.9+4431, Salganik et al. (2023) estimate a critical luminosity of Lcrit ≈ 2.8 × 1037 erg s−1 from the turnover point noticed in the hardness ratio (7–10 keV/4–7 keV) versus 1–10 keV luminosity variations.
The phase-averaged spectral studies from the outburst observation of the pulsar show that the low-energy spectra are formed with the additional contribution from blackbody-like emission from the low-energy X-ray photons. The temperature of the soft blackbody component varies in the energy range 0.24–0.55 keV across the giant outburst, whereas the high-temperature blackbody component that is mostly seen during the peak and declining phases of the giant outburst varies within 1.9–2.7 keV. In terms of the emitting region radius, it can be estimated from the expression relating to blackbody normalization as  , where the source distance, D10, is in units of 10 kpc and Rkm is the radius of the blackbody emitting region in kilometers. It is estimated that the soft blackbody has an emission size radius extending to 5–176 km. The high-temperature blackbody component has an emission radius varying within (∼0.5–∼1.0) km. Li et al. (2024a) have also found that, during the bright state, the emission from the cold blackbody component extends to 10–19 km in radii, to which they relate its emission originating from the optically thick accretion curtain. However the origin of the high-temperature blackbody component, which is atypical for BeXB pulsars, remains speculative. The emission from the hot blackbody component is also seen during the AstroSat observations of RX J0440.9+4431 during the 2022–23 outburst at temperatures of ∼1.6 keV (Sharma et al. 2024), which has been associated with its emission originating from the top of the accretion column as its emission radius extends to 1–2 km. Apart from these two blackbody emission components in the bright X-ray spectra of RX J0440.9+4431, we have also detected two CRSFs seen in hard X-rays varying in energies of 33.6–41.6 keV and 64.6–75.3 keV (see Section 3.2.1). These features are typically seen in the hard X-ray spectra of more than a dozen bright X-ray pulsars at energies of ≃10 keV to ∼100 keV (Staubert et al. 2019; Coburn et al. 2002). An estimate of the NS magnetic field can be obtained from the measured value of cyclotron line energy through the relation
 (4)
(4)
We found it to be varying in the range ≃3.4 × 10¹² G to ≃4.2 × 10¹² G, obtained from the variable cyclotron line energy, where we assumed the canonical values of an NS mass of MNS = 1.4 M⊙ and radius of RNS = 10 km. Based on the theoretical estimates, the expression for critical luminosity in terms of NS surface CRSF energy as per Becker et al. (2012) is  , where Ecycl is the CRSF energy in keV. Considering the variable CRSF energy described above, we estimate the critical luminosity regime to be in the range of 4.67 × 1037 erg s−1–5.85 × 1037 erg s−1. We find that this value is higher than the critical luminosity estimate by Salganik et al. (2023) based on spectral turnover in hardness-luminosity variations of RX J0440.9+4431 during the present giant outburst.
Although the empirical spectral continuum models could successfully describe the spectra across the wide luminosity range exhibited by pulsar accretion column emission, they fail to elucidate a complete physical scenario of the emission spectrum. The application of thermal and bulk Comptonization model (Becker & Wolff 2007) to the phase-averaged and phase-resolved spectra of RX J0440.9+4431 has revealed some important characteristics of the pulsar accretion column emission. During the outburst’s peak episodes, we observe that the column radiation is mostly thermally dominated. This is seen from the lower values of δ during most of the outburst (as is shown in Fig. 8). Alternatively, the higher values of the photon diffusion parameter, ξ, noticed before and after the peak outburst episode, also hint at an elongated accretion column emission structure. From the application of BW model to the phase-averaged outburst spectra of RX J0440.9+4431, we find evidence of the strong magnetic field of the pulsar. The BW model predicts a high magnetic field strength of i.e. ∼1.54 × 10¹³ G in the BeXB pulsar RX J0440.9+4431 during the declining phases of the outburst. We note that, from the observed accretion-induced spin-up of the pulsar during the present outburst, Salganik et al. (2023) also estimate a high magnetic field value for the pulsar of B ≈ 3.5 × 10¹³ G.
Since the pulsar in RX J0440.9+4431 reached the super-critical accretion regime during its recent outburst in 2022–2023, (Malacaria et al. 2024) have reported the appearance of a transient spin-phase-dependent quasi-periodic oscillations (QPOs) at frequencies ∼0.2 Hz from Fermi-GBM observations at source luminosity of 2.8 × 1037 erg s−1. As per the Keplerian frequency model, it has been suggested that the detection of ∼200 mHz QPO during the super-critical regime of accretion implies that the pulsar has a high magnetic field of 2.3 × 10¹³ G (Malacaria et al. 2024). In addition to this, Li et al. (2024b) found that the QPO frequency seen during the flaring episodes at the pulse profiles’ peak varies in the range of 200–500 mHz and assumed its probable origin to be instability seen in the accretion flow. From these variations, they estimate a strong magnetic field of the pulsar of B = (3.3 ± 0.2)×1013 G. However, considering a lower limit on the break frequency, the minimum magnetic field strength of the pulsar is reported as (5.0 ± 0.3)×1012 G (Li et al. 2024b). From the observed QPOs seen at 60 mHz and 42 mHz during the AstroSat observations of the pulsar, when the pulsar is accreting at its sub-critical luminosities of 2.6 × 1037 erg s−1 and 1.5 × 1037 erg s−1, respectively, (Sharma et al. 2024) also report the higher magnetic field of the pulsar to be 7.3 × 10¹³ G and 8.4 × 10¹³ G. From the above discussion, it can be seen that the different methods used to estimate the pulsar’s magnetic field, such as from the variations in QPO frequency, from the rapid spin-up of pulsar during the giant outburst, and from the study of phase-averaged and phase-resolved outburst spectra with a thermal and bulk Comptonization model, imply that the pulsar has a strong magnetic field of ∼1013 G. From the detection of variable CRSF features seen in the Insight-HXMT observed outburst spectra of RX J0440.9+4431 in the present work and previously during the 2010 outburst (Tsygankov et al. 2012) and from setting a lower limit on the break frequency (Li et al. 2024b), the minimum magnetic field strength of the pulsar is estimated to be around ∼1012 G. These results suggest that there is a large spatial offset between the Comptonized emission region and the cyclotron absorption region within the accretion column. Such offsets are also observed in other highly magnetized pulsars, such as 4U 0115+63, in the spectrum of which multiple cyclotron lines were seen (Ferrigno et al. 2009).
Based on the application of Comptonization model (Becker & Wolff 2007) to the phase-averaged outburst spectra of RX J0440.9+4431 observed at different source luminosities, we could compute some of the additional physical parameters associated with the BW model. In Table 1, we estimate some these parameter variations seen at different instances of the giant outburst. The parameters are: (1) α, a positive constant for the assumed velocity profile of the form v(τ) = − αcτ, which is of the order unity for the radiation-dominated pulsar accretion column (Becker 1998; Becker & Wolff 2007); (2) σ∥/σT, scattering cross sections for photons propagating parallel to the magnetic field in terms of the Thomson scattering cross section (σT); (3)  , angle-averaged scattering cross section in terms of σT; (4) J, mass accretion flux (in units of g s−1 cm−2); (5) Tth (× 107 K), thermal mound temperature (in units of 107 K); (6) vth/c, the inflow speed at the mound surface in terms of c; (7) τth, optical depth at the top of the thermal mound; (8) τmax, the optical depth at the top of the radiating zone within the accretion column; and (9) τtrap, the optical depth of the photons for the radiation to be trapped in the lower regions of accretion column, where generally τ < τtrap. The radiation is transported vertically in the column. These parameters are defined, respectively, in equations (33), (79), (83), (84), (88), (89), (92), (93), and (107) of Becker & Wolff (2007).
Computed BW model parameters.
As is shown in Table 1, the inflow speed of the accreting matter reaching the NS thermal mound surface, vth, during the onset and final phases of the giant outburst is < 0.02c. Whereas the free-fall velocity at the top of the accretion column is vff ∼ 0.6c. This represents a significant deceleration of accreting plasma at the thermal mound. During the peak outburst phases (i.e. between MJD 59973–59987), we see a relatively high value of vth (i.e. ≥0.04c) compared to the initial and final stages of the outburst in RX J0440.9+4431. This could be due to the formation of a radiation-dominated shock for the source luminosity reaching Lx ∼ 1037 − 38 erg s−1, wherein the accreting matter is halted at a certain height above the NS surface before it settles down onto the NS surface. For a comparison, during the 2021 giant outburst of EXO 2030+375 at the peak luminosity of 9.65 × 1037 erg s−1, the inflow speed at the NS thermal mound was < 0.02c (Yang et al. 2024). The accretion velocity declines by a factor of ∼7 while the gas passes through the shock (Becker et al. 2012). At the peak luminosity, displayed by the pulsar in RX J0440.9+4431 during the giant outburst, the radiation field could decelerate the accreting gas all the way down to the NS surface.
The temperature of the gas in the thermal mound (Tth) increases with the progression of the outburst, as the source luminosity and mass accretion flux (J) increase. At the peak episodes, Tth varies at higher values of (14–16) × 107 K. As was expected, the electron temperature at the top of the thermal mound, Te, at these episodes is also found to be similar and comparable to Tth (as is shown in Figure 8). From the comparison of τmax and τtrap values obtained at different luminosity states of the pulsar RX J0440.9+4431 during the giant outburst, we find that the condition τmax ≤ τtrap is valid. This shows that the “trapped” region of the accretion column is where most of the observed emission from the pulsar is produced during the giant outburst. In Table 1, we have also estimated the variations seen in two scattering cross section values (i.e. σ∥/σT,  ) with the outburst source luminosity. The σ∥/σT denote the scattering cross section for the photon propagating parallel to the magnetic field in terms of Thomson scattering (σT), whereas the
  denote angle-averaged cross sections in units of σT. The mean scattering cross section for photons propagating perpendicular to the field is usually set to σT, i.e. σ⊥ ≈ σT (Becker & Wolff 2007). At the peak luminosities, we find that
  , i.e. the radiation is subjected to a reduced scattering cross section, which prefers the photons to travel along the magnetic field lines. Thus the accreting material in the column could decelerate to rest at the NS surface instead of being blown away (Ventura 1979; Canuto et al. 1971; Becker & Wolff 2007; Ferrigno et al. 2009). The lower values of the column emission radius, r0 < 50 m, during the outburst peak (shown in Figure 8) also indicate that the photons almost travel to the base of the accretion column before escaping from the column walls, where the plasma temperature is higher.
5. Conclusions
In this paper, we have analyzed all the archival Insight-HXMT observations of the BeXB pulsar RX J0440.9+4431 from its recent giant outburst in late 2022–2023. The pulse profiles during the progress and declining phases of the outburst at similar luminosities show similar variations in shape, which indicates the strong luminosity dependence of the pulse profiles in RX J0440.9+4431. The net X-ray luminosity of the pulsar during the giant outburst spans the range 4.4 × 1036 erg s−1–2.8 × 1037 erg s−1 in 1–120 keV, assuming a distance of 2.44 kpc. The phase-averaged and phase-resolved spectra of the pulsar at different luminosity states could be explained by an absorbed cutoffpl continuum model along with two additional blackbody components at soft X-rays. High-cadence hard X-ray observations of the pulsar reveal the presence of a variable CRSF at energies of (33.6–41.6) keV. During the declining phases of the giant outburst, we have also discovered a second cyclotron line varying in the range of ∼64.6–75.3 keV. The presence of a variable cold blackbody component in (0.24–0.55) keV seen in the phase-averaged and phase-resolved spectral studies implies that its origin is from the optically thick accretion curtain as the size of its emission region extends to (5–176) km, whereas the variation in a hot blackbody component seen in (1.9–2.7) keV, which is atypical of BeXB pulsars, has an emission size within (0.5–1) km originating from the upper regions of the accretion column. We have also used the physics-based thermal and bulk Comptonization model to explore the accretion column emission at many luminosity epochs of the pulsar during the giant outburst. These studies reveal that the pulsar has a strong magnetic field, on the order of ∼1013 G, observed during peak luminosities. Most of the Comptonized emission originates from the narrow and lower regions of the NS accretion column emission, since the column emission radius at outburst peak episodes is found to be < 50 m.
Acknowledgments
We are grateful to the referee for the comments. This work is supported by the NSFC (No. 12133007) and National Key Research and Development Program of China (Grants No. 2021YFA0718503).
References
- Arnaud, K. A. 1996, in Astronomical Data Analysis Software and Systems V, eds. G. H. Jacoby, & J. Barnes, ASP Conf. Ser., 101, 17 [NASA ADS] [Google Scholar]
- Bailer-Jones, C. A. L., Rybizki, J., Fouesneau, M., Demleitner, M., & Andrae, R. 2021, AJ, 161, 147 [Google Scholar]
- Becker, P. A. 1998, ApJ, 498, 790 [NASA ADS] [CrossRef] [Google Scholar]
- Becker, P. A., & Wolff, M. T. 2007, ApJ, 654, 435 [NASA ADS] [CrossRef] [Google Scholar]
- Becker, P. A., & Wolff, M. T. 2022, ApJ, 939, 67 [NASA ADS] [CrossRef] [Google Scholar]
- Becker, P. A., Klochkov, D., Schönherr, G., et al. 2012, A&A, 544, A123 [NASA ADS] [CrossRef] [EDP Sciences] [Google Scholar]
- Canuto, V., Lodenquai, J., & Ruderman, M. 1971, Phys. Rev. D, 3, 2303 [NASA ADS] [CrossRef] [Google Scholar]
- Cao, X., Jiang, W., Meng, B., et al. 2020, Sci. China: Phys. Mech. Astron., 63, 249504 [Google Scholar]
- Chen, Y., Cui, W., Li, W., et al. 2020, Sci. China: Phys. Mech. Astron., 63, 249505 [Google Scholar]
- Coburn, W., Heindl, W. A., Rothschild, R. E., et al. 2002, ApJ, 580, 394 [NASA ADS] [CrossRef] [Google Scholar]
- Coley, J. B., Gendreau, K., Pottschmidt, K., et al. 2023, ATel, 15907, 1 [NASA ADS] [Google Scholar]
- Epili, P., Naik, S., Jaisawal, G. K., & Gupta, S. 2017, MNRAS, 472, 3455 [CrossRef] [Google Scholar]
- Ferrigno, C., Becker, P. A., Segreto, A., Mineo, T., & Santangelo, A. 2009, A&A, 498, 825 [NASA ADS] [CrossRef] [EDP Sciences] [Google Scholar]
- Ferrigno, C., Farinelli, R., Bozzo, E., et al. 2013, A&A, 553, A103 [NASA ADS] [CrossRef] [EDP Sciences] [Google Scholar]
- HI4PI Collaboration (Ben Bekhti, N., et al.) 2016, A&A, 594, A116 [NASA ADS] [CrossRef] [EDP Sciences] [Google Scholar]
- La Palombara, N., Sidoli, L., Esposito, P., Tiengo, A., & Mereghetti, S. 2012, A&A, 539, A82 [NASA ADS] [CrossRef] [EDP Sciences] [Google Scholar]
- Li, P. P., Tao, L., Tuo, Y. L., et al. 2023, MNRAS, 526, 3637 [Google Scholar]
- Li, P. P., Becker, P. A., & Tao, L. 2024a, A&A, 689, A316 [NASA ADS] [CrossRef] [EDP Sciences] [Google Scholar]
- Li, P. P., Tao, L., Ma, R. C., et al. 2024b, MNRAS, 529, 1187 [NASA ADS] [CrossRef] [Google Scholar]
- Liu, C., Zhang, Y., Li, X., et al. 2020, Sci. China: Phys. Mech. Astron., 63, 249503 [Google Scholar]
- Malacaria, C., Ducci, L., Falanga, M., et al. 2023, A&A, 669, A38 [NASA ADS] [CrossRef] [EDP Sciences] [Google Scholar]
- Malacaria, C., Huppenkothen, D., Roberts, O. J., et al. 2024, A&A, 681, A25 [NASA ADS] [CrossRef] [EDP Sciences] [Google Scholar]
- Mandal, M., Sharma, R., Pal, S., et al. 2023, MNRAS, 526, 771 [NASA ADS] [CrossRef] [Google Scholar]
- Mihara, T., Makishima, K., Ohashi, T., Sakao, T., & Tashiro, M. 1990, Nature, 346, 250 [NASA ADS] [CrossRef] [Google Scholar]
- Mihara, T., Makishima, K., & Nagase, F. 1995, in American Astronomical Society Meeting Abstracts, 187, 104.03 [Google Scholar]
- Morii, M., Kawai, N., Sugimori, K., et al. 2010, ATel, 2527, 1 [NASA ADS] [Google Scholar]
- Motch, C., Haberl, F., Dennerl, K., Pakull, M., & Janot-Pacheco, E. 1997, A&A, 323, 853 [NASA ADS] [Google Scholar]
- Nakajima, M., Negoro, H., Mihara, T., et al. 2022, ATel, 15835, 1 [NASA ADS] [Google Scholar]
- Pal, S., Mandal, M., Gendreau, K., et al. 2023, ATel, 15868, 1 [NASA ADS] [Google Scholar]
- Reig, P. 2011, Ap&SS, 332, 1 [Google Scholar]
- Reig, P., & Roche, P. 1999, MNRAS, 306, 100 [NASA ADS] [CrossRef] [Google Scholar]
- Salganik, A., Tsygankov, S. S., Doroshenko, V., et al. 2023, MNRAS, 524, 5213 [NASA ADS] [CrossRef] [Google Scholar]
- Sharma, R., Mandal, M., Pal, S., et al. 2024, MNRAS, 534, 1028 [Google Scholar]
- Staubert, R., Trümper, J., Kendziorra, E., et al. 2019, A&A, 622, A61 [NASA ADS] [CrossRef] [EDP Sciences] [Google Scholar]
- Tsygankov, S. S., Krivonos, R. A., & Lutovinov, A. A. 2012, MNRAS, 421, 2407 [CrossRef] [Google Scholar]
- Usui, R., Morii, M., Kawai, N., et al. 2012, PASJ, 64, 79 [NASA ADS] [Google Scholar]
- Ventura, J. 1979, Phys. Rev. D, 19, 1684 [Google Scholar]
- Verner, D. A., Ferland, G. J., Korista, K. T., & Yakovlev, D. G. 1996, ApJ, 465, 487 [Google Scholar]
- Wilms, J., Allen, A., & McCray, R. 2000, ApJ, 542, 914 [Google Scholar]
- Wolff, M. T., Becker, P. A., Gottlieb, A. M., et al. 2016, ApJ, 831, 194 [Google Scholar]
- Yang, W., Wang, W., & Epili, P. R. 2024, ApJ, 969, 107 [Google Scholar]
- Zhang, S.-N., Li, T., Lu, F., et al. 2020, Sci. China: Phys. Mech. Astron., 63, 249502 [Google Scholar]
Appendix A: Observation log
Observation IDs of the Insight-HXMT observations covering 2022-2023 Giant outburst of RX J0440.9+4431.
Appendix B: Additional figures
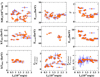 |
Fig. B.1. Variation in spectral parameters of RX J0440.9+4431 w.r.t outburst source luminosity in 1–120 keV of the giant outburst. An absorbed cutoff power-law model (i.e. cutoffpl) with additional components like: 1) a Gaussian component at 6.4 keV , 2) a cyclotron absorption component at 35-40 keV , 3) a soft blackbody component near 0.3 keV , and sometimes a second blackbody component near 2.5 keV has been used to obtain the best-fitted continuum model. |
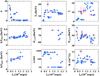 |
Fig. B.2. Best-fitting phase averaged spectral parameters using bwcycl model obtained at different epochs of the giant outburst in RX J0440.9+4431 as observed with Insight-HXMT. The spectral variations are shown with variation in source luminosity across the giant outburst. The error bars represent 1σ uncertainties. |
Appendix C: Phase-resolved spectroscopy with BW Model
We also perform the phase-resolved spectral studies with the BW07 model at the three luminosity epochs as it has been done with the empirical cutoffpl model in section 3.2.2. We have used the same three Insight-HXMT observations, to carry out phase resolved spectroscopy with BW07 model, as those have been used during phase-resolved spectral studies with the cutoffpl model. These observations are namely with ObsdIDs: P0514361025 (during the progress of the outburst), P0514361038 (near the outburst peak) and P0514361057 (at the decline of the outburst, with the similar source luminosity as during the ObsID P0514361025). The broadband spectra of the pulsar obtained from LE, ME and HE during observations (i.e. with ObsIDs: P0514361025, P0514361057) have been divided into 10 pulse-phase bins. Whereas the spectra obtained from ObsID: P0514361038, has been divided into 20 pulse phase bins. To obtain the phase-resolved spectra, we have considered the pulsar spin-period obtained obtained near the epochs of each observation (Li et al. 2023) and folding epochs chosen near each observation such that two complete pulse profiles (in ME: 10–30 keV ) can be seen in 0.0-2.0 pulse-phases. In the top 3 panels of the Figure C.1, we show the pulse-profiles obtained from the light curves in (1–10) keV , (10–30) keV and (30–150) keV respectively for each of the observed epochs.
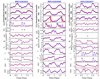 |
Fig. C.1. Variation of spectral parameters with pulse-phases as obtained with a Comptonization model (i.e. bwcycl) at three different luminosity epochs. The error bars represent 1σ uncertainties. The observation IDs are shown on the top of each panel. Corresponding epochs of the Insight-HXMT observations can be seen from Table A.1 in the Appendix. |
The BW07 physical model considers a vertically integrated accretion column emission spectrum that is independent of the viewing angle of observer in the rest frame of the neutron star (Ferrigno et al. 2009; Becker & Wolff 2007). However, its angular dependence emerges from the fact that, it considers the simplified approach of the scattering cross sections for photon propagating in parallel (σ∥) and perpendicular (σ⊥) to the field. Therefore a study of the phase-resolved spectrum of the pulsar could illustrate the variation of scattering cross sections with pulse phases through the variations in the BW physical parameter ξ (as per equation 2). Also the dependency of other physical parameters such as B, Te & δ with pulse-phases can be studied to understand the pulse-phase variations of column emission.
While fitting with BW07 model to the phase-resolved spectra, we fix the values of ṁ and r0 to the values that are obtained during the phase averaged spectral studies. This leaves us to check the variation of other physical BW07 model best-fit parameters such as B12, Te, ξ and δ with pulse phases of the pulsar. Apart from the BW07 model component, we also require two additional bbody components with temperatures kTBB1∼0.3 keV and kTBB2∼3 − 5 keV to better fit the spectra at certain pulse phases. In hard X-rays, we do require the additional absorption component namely cyclabs to account for the variations of CRSF features seen across pulse phases. The pulse-phase variations of CRSF are found similar to the results obtained during the phase-resolved spectral studies with the best-fit empirical cutoffpl model as described in section 3.2.2. In Figure C.1, we show the phase dependency of the best-fit BW07 model parameters across pulse phases of the pulsar in RX J0440.9+4431 during the three epochs of the giant outburst observations with Insight-HXMT. We notice that, the magnetic field, B12 is higher during the peak-intensity phases of the pulse-profile (i.e. between 0.2–0.7 pulse phase) during the outburst peak observation (i.e. ObsID: P0514361038), whereas during the other two epochs, it is found to be higher at the edges of the main peak of the pulse profile. From the variation of δ parameter with pulse phases, we find the contribution of bulk Comptonization w.r.t thermal Comptonization is minimal during the outburst peak as δ was varying within 0.14–0.22. During the progress of the outburst (i.e. in ObsID: P0514361025), we find that, δ was varying within 0.29–0.86, with the higher value observed during the 0.0–0.2 pulse-phases where the minor sub-peak in the pulse profile is seen. This indicates that the contribution of bulk Comptonization w.r.t thermal Comptonization is moderate during the progress of the giant outburst. However, during the declining phases of the outburst (i.e. as in ObsID: P0514361057), we find the δ parameter to be highly variable, reaching higher values of ∼6.63 at peak-intensity phases (i.e. 0.5–0.6 pulse phases) of the pulsar. This indicates that contribution from bulk Comptonization is very high at the main peak of the pulse profile.
During the other pulse phases, we find the relative contribution from thermal Comptonization leading the energization of X-ray photons to higher energies. Moreover, the parameter ξ follows the luminosity phase dependency during the giant outburst peak. In particular, during the outburst peak, we observe ξ reaching values > 15, within 0.1-0.5 pulse phases of the main peak. This implies that the trapping altitude (ztrap) for photon diffusing vertically in the column is more than 30 times the distance of the sonic point from the NS surface (zsp). This makes it feasible for photons to reach higher heights of accretion column emission. However during the pulse phases 0.5-1.0, we see a substantial decrease in the ξ values to 5. This implies that, the Comptonized emission from the pulsar is viewed from different altitudes in the accretion column across the pulse phases or the viewing angle of accretion column is highly variable across the pulse-phases. Similar variations we have seen in case of electron plasma temperature, Te with pulse phases. It is higher during the main peak of the pulse profiles, reaching as high as ∼13.4 keV (during ObsID: P0514361038). However average plasma temperature during this outburst peak observation is (12.2 ± 0.2) keV , which is lower than the average Te values seen during the progress and decline phases of the outburst as observed during ObsID: P0514361025 (Te = 14.5 ± 0.2) keV and ObsID: P0514361057(Te = 14.9 ± 0.4) keV respectively. This hints a partial escape of photons through column walls, leading to cooling of plasma in the accretion column at the outburst peak luminosity episodes. The variation of two flux ratios with pulse phases as shown in two lower panels in Figure C.1 for each of the observed epoch has shown similar variations across pulse phases, as it has been observed during the phase-resolved spectral studies with best fit cutoffpl model (see Section 3.2.2).
All Tables
Observation IDs of the Insight-HXMT observations covering 2022-2023 Giant outburst of RX J0440.9+4431.
All Figures
|
Fig. 1. Long-term Swift/BAT light curve of RX J0440.9+4431 in 15–50 keV covering the 2022–2023 giant outburst duration. The arrows in the insets of the figure represent the start of pointed observations of RX J0440.9+4431 performed with Insight-HXMT. The error bars represent 1σ uncertainties. A log of these pointed observations is shown in Appendix A.1. |
| In the text | |
|
Fig. 2. Energy-resolved pulse profiles of RX J0440.9+4431 obtained by folding the light curves from Insight-HXMT LE (1–10 keV) (two panels from left), ME (10–30 keV) (two panels in the middle) and HE (30–150 keV) (two panels from right) light curves at a similar luminosity during the progress and decline of the giant outburst. Two pulses are shown in each panel for clarity. The error bars represent 1σ uncertainties. The epochs of the observations in MJD are shown inside each panel on the left. The corresponding source luminosity estimates in 1–120 keV are shown in the middle of each panel. |
| In the text | |
|
Fig. 3. Left: (a) Variation in PFs in RX J0440.9+4431 during the 2022–2023 giant outburst in the energy ranges of 1–10 keV, 10–30 keV, and 30–150 keV obtained, respectively, from the LE, ME, and HE light curves. Right: (b) Variation in PF is shown with the outburst source luminosity in 1–120 keV in RX J0440.9+4431 during the 2022–2023 giant outburst in the energy ranges of 1–10 keV, 10–30 keV and 30–150 keV obtained, respectively, from the LE, ME and HE light curves. Table A.1 in the appendix shows the values of these PF estimates and the respective epochs of the giant outburst. The color bar represents the 1–120 keV source luminosity in units of 1037 erg s−1. The two vertical dashed lines at Lx ∼ 1 × 1037 erg s−1 and Lx ∼ 2.2 × 1037 erg s−1 represent the turnover points in the variation of PF with outburst luminosity. |
| In the text | |
|
Fig. 4. Unfolded phase averaged spectra along with best-fitting continuum model shown in the figure in inset (a). We show the spectral residuals obtained with various phenomenological models such as: (b) an absorbed cutoffpl model, (c) an absorbed power law model with a high-energy exponential cutoff, (d) an absorbed two component power law model with a negative and positive exponential cutoff, (e) the best-fitting absorbed cutoff power law model with a cyclotron absorption line component in hard X-rays. The absorption feature in hard X-rays is fit with a multiplicative cyclotron line absorption component (cyclabs in Xspec). The error bars represent 1σ uncertainties. In the inset (a), the observation ID is shown on the right side of the panel. Corresponding epochs of the Insight-HXMT observations can be seen from Table A.1 in the appendix. |
| In the text | |
|
Fig. 5. Variation in spectral parameters of RX J0440.9+4431 at various luminosity epochs of the giant outburst. An absorbed cutoff power-law model (i.e. cutoffpl) with additional components such as (1) a Gaussian component at 6.4 keV, (2) a cyclotron absorption component varying in 33.6–41.6 keV, (3) a soft blackbody component near 0.3 keV, and sometimes a second blackbody component near 2.5 keV, was used to obtain the best-fitted continuum model. |
| In the text | |
|
Fig. 6. Variation in spectral parameters with pulse phases at three luminosity epochs of the pulsar using an absorbed cutoff power law (i.e. cutoffpl) model along with blackbody components. The absorption feature in hard X-rays was fit with a cyclotron line absorption component (cyclabs). The error bars represent 1σ uncertainties. The observation IDs are shown on the top of each panel. Corresponding epochs of the Insight-HXMT observations can be seen from Table A.1 in the appendix. |
| In the text | |
|
Fig. 7. (a): Unfolded spectra of RX J0440.9+4431 in 2–120 keV obtained from three example observations during the late 2022–2023 giant outburst. The spectrum in the left was obtained from ObsID: P0514361025 (near MJD 59965.37) before the outburst peak. The spectrum shown in the middle was obtained from the ObsID: P0514361038, taken at the peak of the outburst (MJD: 59977.804). The spectrum shown on the right side was obtained from the declining phase of the giant outburst at MJD 600005.769 (ObsID: P0514361057). The spectral residuals shown in the panels (b) in each figure were obtained from the BW model without any cyclotron line component, whereas the residuals shown in panels (c) are for the best-fitting BW model that required a cyclotron line component (in all of the three mentioned observations) and a second cyclotron line component (for the ObsID: P0514361038) in hard X-rays. A Gaussian component near 6.4 keV was added to the spectra to account for the emission from neutral Fe Kα line near the pulsar in RX J0440.9+4431. |
| In the text | |
|
Fig. 8. Best-fitting phase-averaged spectral parameters using the bwcycl model obtained at different epochs of the giant outburst in RX J0440.9+4431 observed with Insight-HXMT. The error bars represent 1σ uncertainties. |
| In the text | |
|
Fig. B.1. Variation in spectral parameters of RX J0440.9+4431 w.r.t outburst source luminosity in 1–120 keV of the giant outburst. An absorbed cutoff power-law model (i.e. cutoffpl) with additional components like: 1) a Gaussian component at 6.4 keV , 2) a cyclotron absorption component at 35-40 keV , 3) a soft blackbody component near 0.3 keV , and sometimes a second blackbody component near 2.5 keV has been used to obtain the best-fitted continuum model. |
| In the text | |
|
Fig. B.2. Best-fitting phase averaged spectral parameters using bwcycl model obtained at different epochs of the giant outburst in RX J0440.9+4431 as observed with Insight-HXMT. The spectral variations are shown with variation in source luminosity across the giant outburst. The error bars represent 1σ uncertainties. |
| In the text | |
|
Fig. C.1. Variation of spectral parameters with pulse-phases as obtained with a Comptonization model (i.e. bwcycl) at three different luminosity epochs. The error bars represent 1σ uncertainties. The observation IDs are shown on the top of each panel. Corresponding epochs of the Insight-HXMT observations can be seen from Table A.1 in the Appendix. |
| In the text | |
Current usage metrics show cumulative count of Article Views (full-text article views including HTML views, PDF and ePub downloads, according to the available data) and Abstracts Views on Vision4Press platform.
Data correspond to usage on the plateform after 2015. The current usage metrics is available 48-96 hours after online publication and is updated daily on week days.
Initial download of the metrics may take a while.