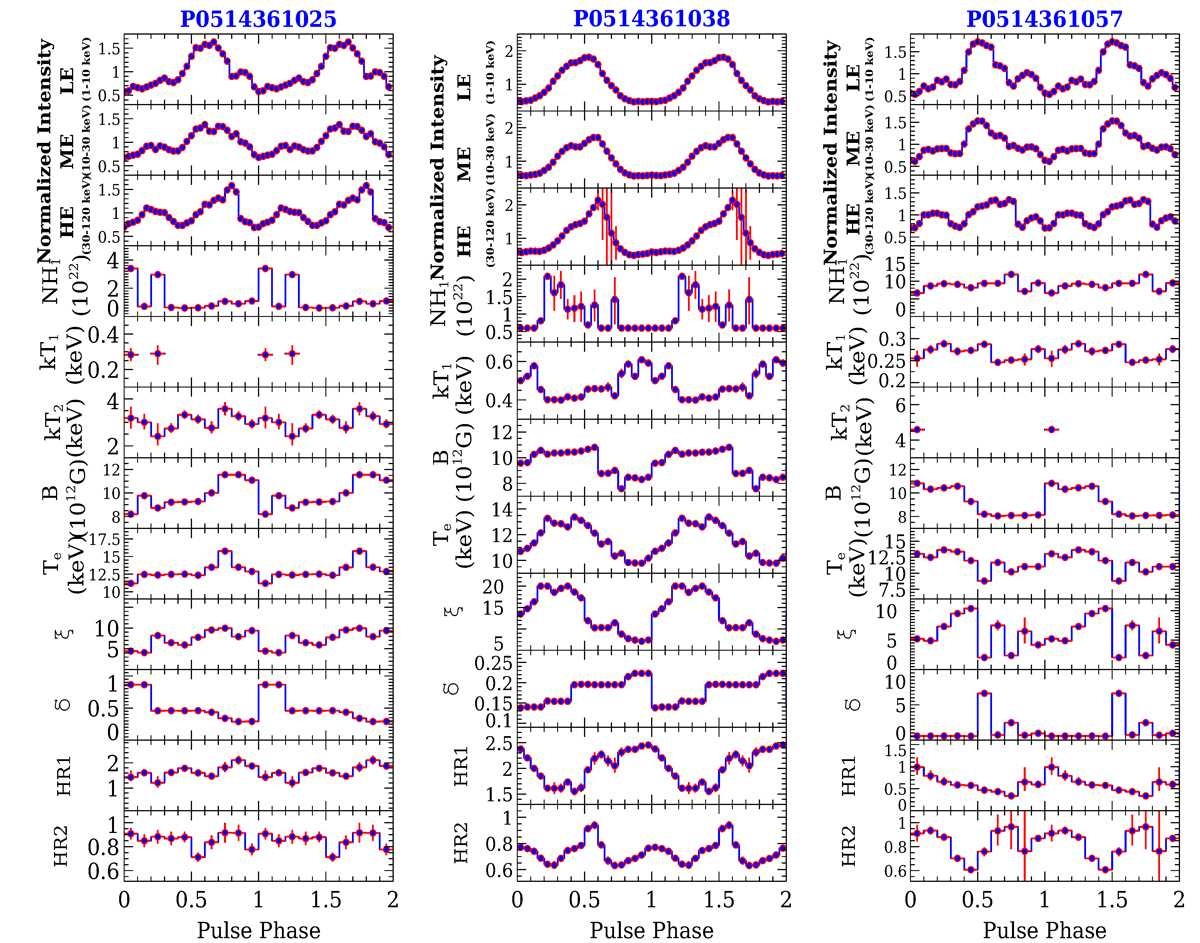
Fig. C.1.
Download original image
Variation of spectral parameters with pulse-phases as obtained with a Comptonization model (i.e. bwcycl) at three different luminosity epochs. The error bars represent 1σ uncertainties. The observation IDs are shown on the top of each panel. Corresponding epochs of the Insight-HXMT observations can be seen from Table A.1 in the Appendix.
Current usage metrics show cumulative count of Article Views (full-text article views including HTML views, PDF and ePub downloads, according to the available data) and Abstracts Views on Vision4Press platform.
Data correspond to usage on the plateform after 2015. The current usage metrics is available 48-96 hours after online publication and is updated daily on week days.
Initial download of the metrics may take a while.