Fig. 3.
Download original image
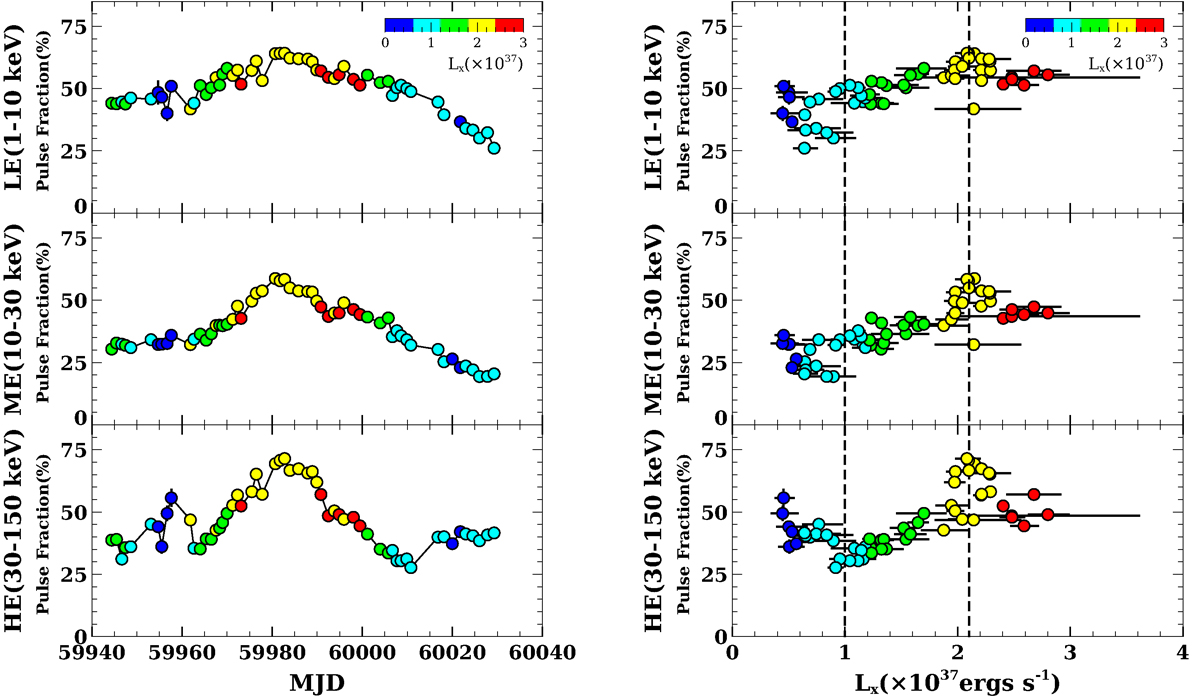
Left: (a) Variation in PFs in RX J0440.9+4431 during the 2022–2023 giant outburst in the energy ranges of 1–10 keV, 10–30 keV, and 30–150 keV obtained, respectively, from the LE, ME, and HE light curves. Right: (b) Variation in PF is shown with the outburst source luminosity in 1–120 keV in RX J0440.9+4431 during the 2022–2023 giant outburst in the energy ranges of 1–10 keV, 10–30 keV and 30–150 keV obtained, respectively, from the LE, ME and HE light curves. Table A.1 in the appendix shows the values of these PF estimates and the respective epochs of the giant outburst. The color bar represents the 1–120 keV source luminosity in units of 1037 erg s−1. The two vertical dashed lines at Lx ∼ 1 × 1037 erg s−1 and Lx ∼ 2.2 × 1037 erg s−1 represent the turnover points in the variation of PF with outburst luminosity.
Current usage metrics show cumulative count of Article Views (full-text article views including HTML views, PDF and ePub downloads, according to the available data) and Abstracts Views on Vision4Press platform.
Data correspond to usage on the plateform after 2015. The current usage metrics is available 48-96 hours after online publication and is updated daily on week days.
Initial download of the metrics may take a while.