Open Access
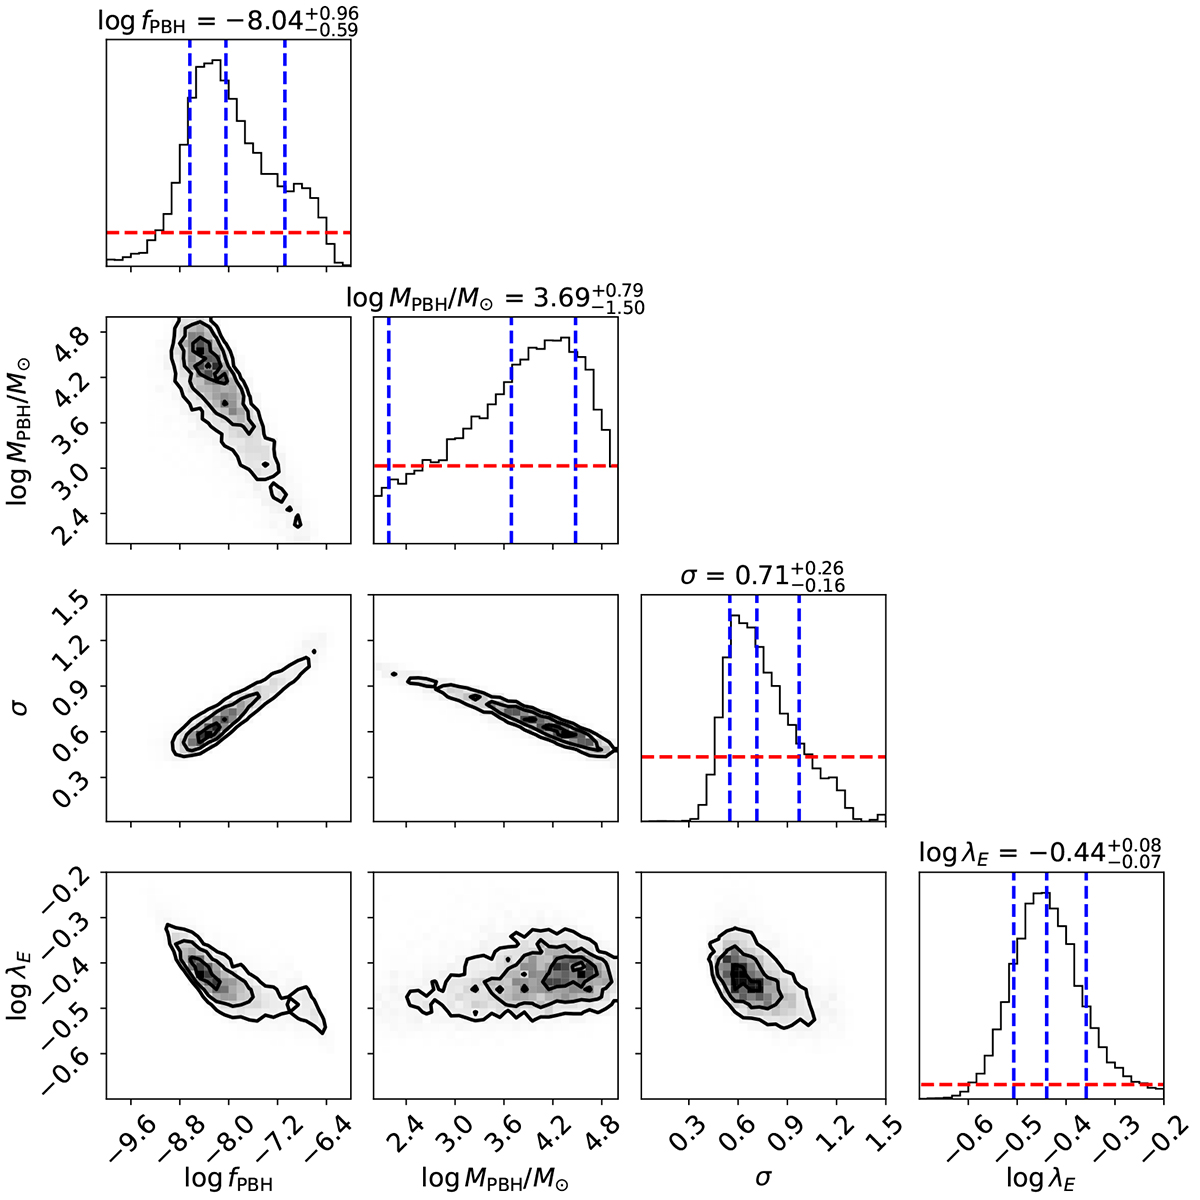
Fig. 1.
Download original image
Corner plot of MCMC results. Priors on parameters are constant over the intervals reported in Table 1 and are plotted as dashed red lines on the 1D distributions. The parameters’ median, 16th, and 84th percentiles are indicated both above the 1D distributions and as vertical dashed blue lines.
Current usage metrics show cumulative count of Article Views (full-text article views including HTML views, PDF and ePub downloads, according to the available data) and Abstracts Views on Vision4Press platform.
Data correspond to usage on the plateform after 2015. The current usage metrics is available 48-96 hours after online publication and is updated daily on week days.
Initial download of the metrics may take a while.