| Issue |
A&A
Volume 701, September 2025
|
|
|---|---|---|
| Article Number | A186 | |
| Number of page(s) | 7 | |
| Section | Extragalactic astronomy | |
| DOI | https://doi.org/10.1051/0004-6361/202554728 | |
| Published online | 12 September 2025 | |
Beyond the first galaxies primordial black holes shine
1
Scuola Normale Superiore, Piazza dei Cavalieri 7, 56126 Pisa, Italy
2
Dipartimento di Fisica “Enrico Fermi”, Università di Pisa, Largo Bruno Pontecorvo 3, Pisa I-56127, Italy
⋆ Corresponding author.
Received:
24
March
2025
Accepted:
14
July
2025
Abstract
The presence of nine candidate galaxies at z = 17 and z = 25 discovered by the James Webb Space Telescope in relatively small sky areas, if confirmed, is virtually impossible to reconcile with the predictions of the current galaxy formation model. We show here that the implied UV luminosity density can be produced by a population of primordial black holes (PBHs) of mass MPBH = 104 − 5 M⊙ residing in low-mass halos (Mh ≈ 107 M⊙), and accreting at a moderate fraction of the Eddington luminosity, λE ≃ 0.36. These sources precede the first significant episodes of cosmic star formation. At later times, as star formation is ignited, PBH emission becomes comparable to, or subdominant with respect to, the galactic emission. This PBH+galaxy scenario reconciles the evolution of the UV luminosity function (LF) from z = 25 to z = 11. If ultra-early sources are powered purely by accretion, this strongly disfavours seed production mechanisms requiring the presence of stars (massive stars, Pop III stars, or clusters), or their UV radiation (direct collapse BHs), leaving PBHs as the only alternative solution available so far. Alternative explanations, such as isolated, large clusters (≈107 M⊙) of massive (m⋆ = 103 M⊙) Pop III stars are marginally viable, but require extreme and unlikely conditions that can be probed via UV and far-infrared (FIR) emission lines or gravitational waves.
Key words: galaxies: evolution / galaxies: high-redshift / galaxies: luminosity function / mass function / quasars: supermassive black holes
© The Authors 2025
 Open Access article, published by EDP Sciences, under the terms of the Creative Commons Attribution License (https://creativecommons.org/licenses/by/4.0), which permits unrestricted use, distribution, and reproduction in any medium, provided the original work is properly cited.
This article is published in open access under the Subscribe to Open model. This email address is being protected from spambots. You need JavaScript enabled to view it. to support open access publication.
1. Introduction
Since the beginning of its operations in July 2022, the James Webb Space Telescope (JWST) has obtained a number of pivotal results that are revolutionizing our view of the early Universe. Remarkably, JWST observations have led to the discovery (Naidu et al. 2022; Castellano et al. 2022; Atek et al. 2023; Labbé et al. 2023) and spectroscopic confirmation (Arrabal Haro et al. 2023; Bunker et al. 2023; Curtis-Lake et al. 2023; Robertson et al. 2023; Wang et al. 2023a; Hsiao et al. 2024; Zavala et al. 2025) of super-early (z > 10) galaxies up to redshift z ≈ 14 (Carniani et al. 2024), when the Universe was ≈300 Myr old. These results challenge expectations based on pre-JWST data, theoretical predictions, and perhaps even ΛCDM-based1 galaxy formation scenarios.
Super-early galaxies are characterized by bright UV luminosities (MUV ≲ −20), steep UV spectral slopes (β ≲ −2.2, Topping et al. 2022; Cullen et al. 2024; Morales et al. 2024), compact sizes (effective radius re ≲ 100 pc, Baggen et al. 2023; Morishita et al. 2024; Carniani et al. 2024), large (for their epoch) stellar masses (M⋆ ≈ 109 M⊙), and thus are sometimes nicknamed “Blue Monsters” (Ziparo et al. 2023). Explaining their relatively large comoving number density (n ≈ 10−5 − 10−6 cMpc−3; see, e.g., Casey et al. 2024; Harvey et al. 2025) requires the introduction of new physical ingredients in standard galaxy evolution models.
These additions include (a) high star formation variability (Furlanetto & Mirocha 2022; Mason et al. 2023; Mirocha & Furlanetto 2023; Sun et al. 2023; Pallottini & Ferrara 2023; Gelli et al. 2024), (b) reduced feedback resulting in a higher star formation efficiency (feedback free model, FFB, Dekel et al. 2023; Li et al. 2024), (c) a top-heavy IMF or primordial stars (Inayoshi et al. 2022; Wang et al. 2023b; Trinca et al. 2024; Hutter et al. 2025; Cueto et al. 2024), and (d) very low dust attenuation (Attenuation-Free Model, AFM, Ferrara et al. 2023; Ziparo et al. 2023; Fiore et al. 2023; Ferrara 2024a,b; Ferrara et al. 2025). These models have been, to varying degrees, successful in explaining, at least in part, the statistical or evolutionary properties of the newly discovered super-early galaxy population.
However, JWST data continue to be a source of genuine surprises. Pérez-González et al. (2025) have recently reported the discovery of six F200W and three F277W robust dropout sources that are consistent with being at z ≈ 17 and z ≈ 25, respectively (see also Harikane et al. 2024; Kokorev et al. 2025; Whitler et al. 2025; Gandolfi et al. 2025; Castellano et al. 2025). The detection, if confirmed, implies exceptionally high number densities; i.e., for MUV = −18 sources ≈10−4.2(10−5) Mpc−3 at z = 17 (z = 25) which, yet again, are at odds with all current models. These ultra-early galaxies, if confirmed spectroscopically, effectively falsify all the solutions proposed above. We are therefore compelled to explore “beyond standard model” (BSM) scenarios to explain their existence in such large numbers. Specifically, this means considering modifications to the ΛCDM model.
This typically entails assuming different cosmological scenarios that enhance the halo mass function (HMF) at z > 10 (Haslbauer et al. 2022; Boylan-Kolchin 2023), either through effective modification of the transfer function (Padmanabhan & Loeb 2023), or by exploring different models, such as an early dark energy contribution at z ≈ 3400 (Klypin et al. 2021; Shen et al. 2024), the tilt of the primordial power spectrum (Parashari & Laha 2023), the importance of non-Gaussianities (Biagetti et al. 2023), and the presence of primordial black holes (PBHs, Liu & Bromm 2022; Matteri et al. 2025).
Among these modifications, solving the overabundance problem with PBHs is appealing, since their impact tends to decrease with cosmic time. For this reason, PBH solutions do not cause insurmountable tensions at z < 10, contrary to other BSM proposals (Gouttenoire et al. 2024; Sabti et al. 2024). This solution is also particularly attractive as it is known that some of the super-early galaxies (GN-z11, Maiolino et al. 2024a; GHZ2, Castellano et al. 2024; GHZ9, Napolitano et al. 2024; UHZ1, Natarajan et al. 2024) contain massive black holes that contribute significantly to the observed luminosity of the source. In addition, PBHs could provide optimal seeds from which supermassive BHs can subsequently grow (Rubin et al. 2001; Düchting 2004; Khlopov 2010; Kawasaki et al. 2012; Dayal 2024; Ziparo et al. 2025).
In this paper, building on the results from Matteri et al. (2025, M25 hereafter), we propose that the very slow measured decrease of ρUV(z) at z > 15 is sustained by PBHs even before the first galaxies form in detectable numbers. Hence, ultra-early galaxies could be systems whose emission is completely dominated by accretion onto PBHs, rather than of stellar origin.
2. Model
M25 presented an effective model, calibrated using data at lower redshifts, to predict the luminosity function (LF) of super-early galaxies, including the additional PBH contribution. M25 show that such a model can physically explain the overabundance of bright galaxies observed at z = 11. Primordial black holes can affect the LF in two distinct ways: by (a) enhancing the dark matter power spectrum due to their discrete spatial distribution, and/or (b) contributing accretion luminosity to the host galaxy, i.e., as an Active Galactic Nucleus (AGN).
The distribution of PBHs at formation is modelled by a lognormal mass function with characteristic mass MPBH, standard deviation σ, and accounting for a mass fraction fPBH of the dark matter content of the Universe. Their luminosity is produced at a constant Eddington ratio λE = L/LE, where LE is the Eddington luminosity. The original model does not account for the growth of PBHs with time (that is, the PBH mass is assumed to be constant). Stellar emission is accounted for by an effective astrophysical model whose parameters are calibrated on the measured LFs in the range 4 < z < 9 (see M25, Fig. 2).
Within these simplified settings, the overabundance of bright galaxies at z ≈ 11 is explained by the model when a small fraction (fPBH ≈ 10−8) of low-mass (MPBH ≈ 104 M⊙) PBHs accrete at super-Eddington (λE ≈ 10) rates, without violating any current constraint from the cosmic microwave background (CMB, Nakama et al. 2018; Serpico et al. 2020).
In the present work, we extend the M25 model by considering PBH growth self-consistently with accretion as follows. For a given radiative efficiency, η, we assumed that a PBH formed at the radiation-matter equality redshift, zeq = 3400 (Planck Collaboration VI 2020), with mass M0 by redshift z < zeq will have a mass
![Mathematical equation: $$ \begin{aligned} M(z) = M_0 \exp \Bigg [\frac{t(z)-t(z_{\rm eq})}{t_{S}}\lambda _{\rm E}\frac{1-\eta }{\eta }\Bigg ] \equiv M_0 g(z, z_{\rm eq}) \end{aligned} $$](/articles/aa/full_html/2025/09/aa54728-25/aa54728-25-eq1.gif) (1)
(1)
where tS = 450 Myr is the Salpeter time (Salpeter 1964), t(z) is the age of the Universe at redshift z, and g(z, zeq) is the implicitly defined growth function. We fixed η = 0.1 and left λE as a parameter to be determined by matching the data.
Evolving the initial lognormal distribution via Eq. (1) retains this functional form once the parameters are updated as follows:
![Mathematical equation: $$ \begin{aligned}{[M_{\rm PBH}, f_{\rm PBH}]}(z)&= g(z,z_{\rm eq}) [M_{\rm PBH}, f_{\rm PBH}](z_{\rm eq})\\ \sigma (z)&= \sigma (z_{\rm eq}) \nonumber . \end{aligned} $$](/articles/aa/full_html/2025/09/aa54728-25/aa54728-25-eq2.gif) (2)
(2)
This growth shifts the logarithm of the PBH mass by a constant, affecting only the peak position and leaving the shape of the distribution unaltered. Relaxing the approximation of a constant and uniform λE would lead to a more complex evolution, i.e, we expect the scatter to increase. This means that either a different functional form for the mass function is produced at late times or that at least σ grows with cosmic time. Unfortunately, current data quality prevents us from adopting a more refined framework.
Following M25, we seeded PBHs in halos above a redshift-dependent mass Mmin, implicitly defined by
 (3)
(3)
where n0 is the comoving density of halos corresponding to Mmin = 107.5 M⊙ at z = 11 and dn/dMh is the HMF. Although this choice can be justified by the physical arguments discussed in M25, it is admittedly uncertain. Nevertheless, we have checked that it has only a very minor impact on our results as long as Mmin is roughly 5 × 10⁷ M⊙ at z = 11. We note that in our scheme, both PBHs and dark matter halos grow with time, but at different rates, respectively given by Eq. (2) and the cosmological accretion rate governing the HMF evolution (Eq. (3)).
We note that for any (σ, λE) pair, a degeneracy exists between the other two parameters, MPBH, and fPBH, such that the derived UV LF depends only on the ratio of these two quantities. These must satisfy, at z = 11, the relation  (M25). Applying Eq. (2), we next constructed the predicted UV LF at any redshift.
Finally, from the UV LF, we computed the UV luminosity density, ρUV, which is defined as
 (4)
(4)
where LUV is the specific UV luminosity corresponding to the magnitude MUV, ΦUV is the LF, and  is the faint-end magnitude limit, conventionally set to −17, as in the observational data adopted below.
Similarly to M25, we inferred the best parameters of this model in a Bayesian framework by running a Monte Carlo Markov Chain (MCMC). We used fPBH, MPBH, σ, and λE as parameters and the luminosity function data at z = 11 (from Donnan et al. 2024; McLeod et al. 2024), 17, and 25 (both from Pérez-González et al. 2025) as constraints. Flat priors were used on the parameters over the intervals listed in Table 1. Limits on MPBH were chosen to avoid both small PBHs and violation of current limits from CMB distortions (Byrnes et al. 2024; Pritchard et al. 2025).
Prior limits on MCMC parameters.
3. Results
The MCMC analysis yields a one-peaked parameter distribution (see corner plot reported in Fig. 1), which we proceed to sample to build a fiducial model. In Fig. 2 we present the UV LFs predicted by our fiducial model at different redshifts (see Table 2 for the parameters at each redshift of interest). At z = 11, the model matches the observed data well. At MUV ≃ −21(−19), PBHs contribute about 75% (50%) of the UV luminosity of the source, with the remaining 25% (50%) produced by stars. Notably, at z = 11 our model is virtually indistinguishable from the AFM (dashed line), which includes only unattenuated radiation from stars (i.e., no PBHs).
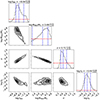 |
Fig. 1. Corner plot of MCMC results. Priors on parameters are constant over the intervals reported in Table 1 and are plotted as dashed red lines on the 1D distributions. The parameters’ median, 16th, and 84th percentiles are indicated both above the 1D distributions and as vertical dashed blue lines. |
At z = 17 the AFM predicts a ≈3 dex UV LF drop at MUV = −19, driven essentially by the steep decline of the HMF, resulting in a source comoving density ≲10× the one observed by Pérez-González et al. (2025), if confirmed. In contrast, our model fits the data well, as PBH emission, regulated by mass growth, declines less steeply than the HMF. Consequently, the observed luminosity becomes largely (> 90%) dominated by PBHs.
This trend persists as we extend our analysis to z = 25, as illustrated in the right panel of Fig. 2. Remarkably, the observed UV LF, if confirmed, shows only a relatively modest tenfold decrease, surpassing even the z = 17 predictions (which align well with data up to z = 11 − 12) of galaxy formation models such as the AFM (Ferrara et al. 2025), feedback-free models Li et al. (2024), and semi-analytical approaches (Somerville et al. 2025). It should be noted that even if only one of the candidates is confirmed, the strong tension with the previous models remains unresolved. This suggests that standard galaxy formation models lack a crucial component, which we propose to be very early or primordial black holes. Indeed, when these are incorporated, our model consistently reproduces the z = 25 UV LF (red curve).
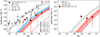 |
Fig. 2. UV luminosity functions at redshift z = 11, z = 15, z = 17 (left and right panels), and z = 25 (right panel). Solid lines represent our median predictions (galaxies plus PBH emission) with credible intervals at the 16th and 84th percentiles shown as shaded areas. Dashed lines show the AFM results (Ferrara et al. 2023) for galaxies only. Red hexagons denote z = 17 and 25 observations from Pérez-González et al. (2025); other points represent data in the range 11 ≤ z ≤ 19 from Donnan et al. (2024), McLeod et al. (2024), Robertson et al. (2024), Morishita et al. (2025), Harikane et al. (2024), Kokorev et al. (2025), Yan et al. (2023), Whitler et al. (2025). |
We corroborate these conclusions by examining the predicted redshift evolution of the UV luminosity density, ρUV, compared to available data in Fig. 3. The black line represents our model without PBH accretion, where UV light is produced solely by stars. Consistent with most galaxy evolution models, ρUV is in good agreement with the data at z ≈ 10, but declines dramatically at early epochs. Including PBH emission, however, recovers the observed data, if confirmed, producing a slower decline in ρUV.
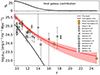 |
Fig. 3. UV luminosity density (integrated to a limiting magnitude |

This feature can be understood by first noting (upper panel in Fig. 3) that the UV contribution from stars in the host galaxy drops below 10% by z = 14, indicating that ultra-early sources are dominated by PBH light. Combining this result with the relatively slow decrease of the PBH peak mass from  at z = 11 to
  at z = 25, driven by a moderate accretion rate (λE ≈ 10−0.44 ≈ 0.36), provides the final interpretation of the trend. Thus, light production in the Universe shifts from stars to accretion onto PBHs towards cosmic dawn.
A magnitude MUV ≈ −18 corresponds to a UV luminosity produced by a PBH with mass 2.2 × 10⁶ M⊙ accreting at λE = 0.36, assuming a bolometric correction fbol(LUV) = 0.13 (Shen et al. 2020). This represents a relatively rare (≈3σ) peak in the PBH mass distribution. The corresponding accreting PBH X-ray luminosity is well below the current Chandra detection limits (Xue et al. 2016).
The comoving number density of PBHs is nPBH ∝ fPBH/MPBH when σ is fixed. Such a ratio, according to Table 2 (see also Eq. (8) in M25), does not evolve with redshift. This arises because PBHs only form during the radiation-dominated era and are assumed to not evaporate or merge later on. As a result, the model parameters reported in Table 2 yield  . Using the result in Eq. (3), this implies that only a small fraction (nPBH/n0 ≈ 10−3 at median density) of halos above Mmin actually host PBHs. We can use this argument to calculate the typical mass of halos hosting a PBH shining at MUV = −18 at z = 25 to be log(Mh/M⊙)≈7.5, corresponding to a ratio MPBH/Mh = 0.07.
Fiducial values of parameters regulating PBH properties and evolution.
4. Discussion
The result above indicate that ultra-high (z > 15) redshift galaxies, if confirmed, pose an exceptionally difficult challenge to theoretical models of galaxy formation. Motivated by this urgency, we have explored an alternative solution provided by PBHs. We find that ultra-early galaxies must be largely, if not entirely, dominated by emission from accretion onto intermediate-mass PBHs rather than by stars.
This scenario is sufficiently extreme to entail a number of implications that warrant a closer inspection. Here, we limit our discussion to the most obvious ones. However, before doing so, we note that if the z = 25 candidates are powered by PBHs, we expect them to be very compact and show an almost point-like morphology. Visual inspection of the cutout images of the three objects appears to confirm this hypothesis.
Additionally, if we are observing the light from the accretion disk, the UV continuum spectrum should follow a simple power law of the form Fλ ∝ λβ with β = −2.33 (Shakura & Sunyaev 1973). The values measured for the three most distant objects in the Pérez-González et al. (2023) sample (midis-z25-1, midis-z25-2, and midis-z25-3) are β = ( − 2.6 ± 0.4, −3.0 ± 0.4, −2.4 ± 0.6). These are broadly consistent within 1σ, although we note that these values were derived from only two photometric bands and therefore are likely to be highly uncertain.
The abundance of PBHs is constrained by several observables that would be affected by their presence (Carr et al. 2021). These translate into upper limits on the PBH abundance as a function of mass. For masses on the order of 102 − 5 M⊙, these constraints tighten with MPBH, and PBHs more massive than 105 M⊙ are virtually incompatible with CMB observations due to the production of an undetected μ-distortion (Chluba et al. 2012; Nakama et al. 2018; Sharma et al. 2024). Our model requires a relatively small (fPBH ≈ 10−8) population of mid-mass (MPBH ≈ 104 M⊙) PBHs (Table 2), whose parameters (MPBH, fPBH) lie within the current constraints assuming the monochromatic approximation, i.e., assuming all PBHs have the same mass MPBH. However, the long tail of the lognormal produces a small amount (2σ outliers) of ≳105 M⊙ PBHs, which are in tension with these constraints. As stated in the literature (Nakama et al. 2018; Byrnes et al. 2024; Pritchard et al. 2025), monochromatic limits relax when primordial fluctuations are assumed to be non-Gaussian and are also affected by the specific shape of the PBH mass function (Wang et al. 2025), implying that the typical PBHs in our model may not be excluded. That is, a mass function with a shorter tail could comply with current limits, while still explaining observations at z = 25 as the most massive outliers, eventually requiring a faster accretion onto PBHs or mergers. We defer exploration of this scenario to future work beyond this paper.
4.1. Implications of the PBH scenario
4.1.1. Nature of seeds
The first implication of our results is that beyond the first galaxies, PBHs were already active and shining. If ultra-early sources are powered by accretion onto BHs, then a stellar origin for the seeds becomes unlikely.
Two popular pathways for seed formation (for a review, see Latif & Ferrara 2016), core-collapse supernovae and dense stellar clusters, both require the presence of stellar progenitors. The third pathway, direct collapse black holes, requires a strong UV background to prevent fragmentation caused by H2 formation; this UV radiation must also be initially produced by stars.
The PBHs required by our model have characteristic masses of 104 − 5 M⊙ already at z = 25 − 17. Therefore, they could serve very well as supermassive black hole seeds. Indeed, considering their growth, their mass approaches those inferred for GN-z11 at z = 10.6, i.e., log(M•/M⊙) = 6.2 ± 0.3 (Maiolino et al. 2024b).
4.1.2. Reionization
PBHs could begin to emit radiation as early as z ≈ zeq, potentially illuminating the cosmic Dark Ages (60 < z < 1100), the epoch before the formation of the first stars. This emission could, in effect, “erase” the Dark Ages by providing an early source of light.
Additionally, PBHs may influence the reionization of cosmic hydrogen. The comoving ionization rate density is given by the relation  , with the 1500 Å – LyC conversion factor ξion ≈ 1026 Hz erg−1 appropriate for accreting black holes (Madau et al. 1999). This yields
  at z = 25 and
  at z = 12. Photoionization is balanced by recombinations in the intergalactic medium, giving an equilibrium cosmic hydrogen fraction
  at z = 25 and (1 − xHI)≈0.2fesc at z = 12. Hence, ionization due to PBHs is expected to be very modest, even if fesc = 1. These values could also remain undetected in the Thomson optical depth of the CMB, considering that a reasonable escape fraction of fesc ≈ 0.1 would yield a reionization epoch very similar to that expected from observations (Greig & Mesinger 2017). However, it is likely that, in the configuration where the PBH accretes at the center of a Mh ≈ 107 M⊙ halo at sub-Eddington rates (and thus without radiation-driven outflows clearing the gas), fesc ≪ 1, given the typical absorbing gas column density (≳1021 cm−2) in these primordial objects.
Such PBHs could also impact reionization by heating the intergalactic medium (IGM) via X-ray emission. Although the very dense Universe in which these objects accrete may prevent X-rays from escaping, that is, the accreting gas may become Compton thick, we note that the abundance of these objects is very low. Ricotti & Ostriker (2004) consider a scenario in which PBHs pre-ionize the IGM at z ≳ 20, showing that a fraction ≈6.8 × 10⁻⁶ of baryons must be accreted to significantly impact the medium, i.e., ionize about 50% of the hydrogen. In our model, PBHs constitute a fraction fPBH ≈ 2 × 10⁻⁷ of dark matter at z = 11, implying that they accrete up to fPBHΩdm/Ωb ≈ 10−6 of the total baryonic mass by that time, which is still below their limit.
4.2. Could they be Pop III stars?
As an alternative to the PBH hypothesis, we can speculate that the observed sources are powered by Pop III stellar clusters. The (bolometric) light-to-mass ratio of individual massive Pop III stars increases from Υ = 1405 L⊙/M⊙ for a m⋆ = 15 M⊙ star to Υ = 2.7 × 10⁴ L⊙/M⊙ at m⋆ = 103 M⊙ (Schaerer 2002); raiter:2010. To maximize detectability, we assume that a cluster of m⋆ = 103 M⊙ stars has already formed at z = 25. As a UV bolometric correction in the rest-frame wavelength range 1300 − 1600 Å, approximately covered by the NIRCam F356W filter, we obtain fbol ≃ 0.016, appropriate for a black-body spectrum with log(Teff/K) = 5.026. A magnitude MUV = −18, as observed for the two faintest sources at z = 25, if confirmed, translates to a UV luminosity LUV = 109.55 L⊙. Combining these results, we conclude that a total Pop III stellar mass of M⋆,III ≈ 8.2 × 10⁶ M⊙ is required, equivalent to roughly 8200 stars each with m⋆ = 103 M⊙.
These massive stars have very short lifetimes, t⋆ = 1.9 Myr (Schaerer 2002), yielding an approximate duty cycle fduty = t⋆/t(z = 25) = 0.014, where t(z = 25) = 133.2 Myr is the cosmic age at z = 25. Given the observed comoving number density (n ≈ 10−5 Mpc−3) of such objects and the duty cycle, the cluster of Pop III stars should be hosted by halos with a number density  times higher. This corresponds to a halo of mass Mh = 9 × 10⁷ M⊙ or a virial temperature of 5 × 10⁴ K, characteristic of an atomic cooling halo. The gas content in such halos is
  . Thus, it would be necessary to convert 60% of the halo gas content into m⋆ = 1000 M⊙ stars in ≪1.9 Myr to produce the required luminosity. Hence, if possible at all, very extreme conditions would be required by the Pop III interpretation. Such a high star formation efficiency should also be a relatively rare phenomenon, as implied by the Thompson optical depth of the CMB (Visbal et al. 2015) and by the impact on the IGM temperature of binary BH remnants (Mirabel et al. 2011).
Although extreme, the Pop III scenario cannot yet be completely excluded and should be considered in parallel to the PBH solution proposed here. The HeIIλ1640 line luminosity produced by a 1000 M⊙ Pop III star is 4.2 × 10⁵ L⊙. The total luminosity of the cluster is then LHeII = 3.4 × 10⁹ L⊙. This corresponds to a line flux ≈2.9 × 10⁻¹⁸ erg s−1 cm−2 (≈1.3 × 10⁻¹⁹ erg s−1 cm−2) at z = 17 (z = 25), i.e., it should be detectable by the NIRSpec deep pointings of a JADES-like survey (Eisenstein et al. 2023). Interestingly, the line may contaminate the F277W (F444W) filter band for z = 17 (z = 25) sources, making their spectra bluer (redder). We caution that HeIIλ1640 could also be excited by PBH emission.
We also consider that before such massive stars collapse into a stellar BH at the end of their lives, they may release non-negligible amounts of heavy elements (primarily CNO) into the surrounding medium via mass-loss. According to Marigo et al. (2003), a rotating 103 M⊙ Pop III star produces (1.18, 1.7 × 10⁻⁵, 1.5) M⊙ of (C, N, O), respectively. Hence, once diluted in a gas mass approximately equal to M⋆,III, this corresponds to a gas metallicity Z ≈ 0.11 Z⊙. These elements could potentially generate UV lines detectable by JWST (CIVλ1549, CIII]λ1907, 1909) or by ALMA (e.g. [OI]63 μm, [OIII]88 μm), thereby enabling discrimination between the PBH and Pop III scenarios.
Perhaps the most promising perspective to clarify the nature of these sources is to use gravitational waves (GW). Stellar BHs left by m⋆ = 103 M⊙ Pop III stars could merge and produce a GW signal. Neglecting mass loss and assuming complete collapse, the chirp mass of the binary is ℳ = 870 M⊙, and the signal would peak at a characteristic frequency fm ≈ 10 Hz. The strain is then h ≈ 10−21(Gpc/DL), where the luminosity distance to z = 25 is DL = 295 Gpc, yielding h ≈ 3.4 × 10⁻²⁴. This signal corresponds to a signal-to-noise ratio S/N = 3.4 for the expected sensitivity of the Einstein Telescope at 10 Hz (Abac et al. 2025). Clearly, this is an intriguing possibility that deserves further study.
5. Summary
We have shown that the discovery of nine candidate galaxies at z = 17 and z = 25, if confirmed, is virtually impossible to reconcile with current galaxy formation model predictions. However, the implied UV luminosity density can be produced by a relatively small (fPBH ≈ 10−8) population of primordial black holes (PBHs) described with a lognormal distribution of characteristic mass MPBH = 104 − 5 M⊙, typically residing in low-mass halos (Mh ≈ 107 M⊙), and accreting at a moderate fraction of the Eddington luminosity, λE ≃ 0.36. Both the point-like morphology and the observed blue spectra of the detected sources are consistent with this hypothesis, which also complies with current constraints on the mass and abundance of PBHs.
PBH sources precede the first significant episodes of cosmic star formation. At later times, as star formation initiates, PBH emission becomes comparable to or subdominant with respect to that of the hosting galaxy. If ultra-early sources are powered purely by accretion, this strongly disfavors seed production mechanisms requiring the pre-existence of stars (massive or Pop III stars or clusters) or their UV radiation (direct collapse BHs), leaving PBHs as the only alternative solution currently available.
Alternative explanations, such as isolated large clusters (≈107 M⊙) of massive (m⋆ = 103 M⊙) Pop III stars, are only marginally viable. They require extreme and very unlikely conditions that can nevertheless be tested via UV (e.g. HeII, CIII]) and FIR (e.g. [CII], [OIII]) emission lines or gravitational waves.
Throughout the paper, we assume a flat Universe with the following cosmological parameters: Ωm = 0.3111, ΩΛ = 1 − Ωm, Ωr = 9.1 × 10⁻⁵, and Ωb = 0.04897, h = 0.6766, σ8 = 0.8102, where Ωm, ΩΛ, Ωr, and Ωb are the total matter, vacuum, radiation and baryon densities, in units of the critical density; h is the Hubble constant in units of 100 km s−1 Mpc−1, and σ8 is the late-time fluctuation amplitude parameter (Planck Collaboration VI 2020).
Acknowledgments
We thank S. Carniani, M. Castellano, E. Ntormousi, E. Parlanti, P. Pérez-González, G. Rodighiero, P. Rosati, S. Salvadori, L. Vallini, E. Vanzella, S. Vergani, A. Zanella, and F. Ziparo for useful discussions. AF acknowledges support from the ERC Advanced Grant INTERSTELLAR H2020/740120. Partial support (AF) from the Carl Friedrich von Siemens-Forschungspreis der Alexander von Humboldt-Stiftung Research Award is kindly acknowledged. We gratefully acknowledge the computational resources of the Center for High Performance Computing (CHPC) at SNS. We acknowledge usage of WOLFRAM|ALPHA, the PYTHON programming language (Van Rossum & de Boer 1991; Van Rossum & Drake 2009), ASTROPY (Astropy Collaboration 2013), CORNER (Foreman-Mackey 2016), EMCEE (Foreman-Mackey et al. 2013), HMF (Murray et al. 2013), MATPLOTLIB (Hunter 2007), NUMPY (van der Walt et al. 2011), SCIPY (Virtanen et al. 2020), MULTIPROCESS (McKerns et al. 2012); pathos, and statistical approximations from Romeo et al. (2003).
References
- Abac, A., Abramo, R., Albanesi, S., et al. 2025, ArXiv e-prints [arXiv:2503.12263] [Google Scholar]
- Adams, N. J., Conselice, C. J., Austin, D., et al. 2024, ApJ, 965, 169 [NASA ADS] [CrossRef] [Google Scholar]
- Arrabal Haro, P., Dickinson, M., Finkelstein, S. L., et al. 2023, ApJ, 951, L22 [NASA ADS] [CrossRef] [Google Scholar]
- Astropy Collaboration (Robitaille, T. P., et al.) 2013, A&A, 558, A33 [NASA ADS] [CrossRef] [EDP Sciences] [Google Scholar]
- Atek, H., Shuntov, M., Furtak, L. J., et al. 2023, MNRAS, 519, 1201 [Google Scholar]
- Baggen, J. F. W., van Dokkum, P., Labbé, I., et al. 2023, ApJ, 955, L12 [NASA ADS] [CrossRef] [Google Scholar]
- Biagetti, M., Franciolini, G., & Riotto, A. 2023, ApJ, 944, 113 [NASA ADS] [CrossRef] [Google Scholar]
- Bouwens, R., Illingworth, G., Oesch, P., et al. 2023, MNRAS, 523, 1009 [NASA ADS] [CrossRef] [Google Scholar]
- Boylan-Kolchin, M. 2023, Nat. Astron., 7, 731 [NASA ADS] [CrossRef] [Google Scholar]
- Bunker, A. J., Saxena, A., Cameron, A. J., et al. 2023, A&A, 677, A88 [NASA ADS] [CrossRef] [EDP Sciences] [Google Scholar]
- Byrnes, C. T., Lesgourgues, J., & Sharma, D. 2024, JCAP, 2024, 012 [Google Scholar]
- Carniani, S., Hainline, K., D’Eugenio, F., et al. 2024, Nature, 633, 318 [CrossRef] [Google Scholar]
- Carr, B., Kohri, K., Sendouda, Y., & Yokoyama, J. 2021, Rep. Progr. Phys., 84, 116902 [Google Scholar]
- Casey, C. M., Akins, H. B., Shuntov, M., et al. 2024, ApJ, 965, 98 [NASA ADS] [CrossRef] [Google Scholar]
- Castellano, M., Fontana, A., Treu, T., et al. 2022, ApJ, 938, L15 [NASA ADS] [CrossRef] [Google Scholar]
- Castellano, M., Napolitano, L., Fontana, A., et al. 2024, ApJ, 972, 143 [Google Scholar]
- Castellano, M., Fontana, A., Merlin, E., et al. 2025, A&A, submitted (aa55082-25) [arXiv:2504.05893] [Google Scholar]
- Chluba, J., Erickcek, A. L., & Ben-Dayan, I. 2012, ApJ, 758, 76 [Google Scholar]
- Cueto, E. R., Hutter, A., Dayal, P., et al. 2024, A&A, 686, A138 [NASA ADS] [CrossRef] [EDP Sciences] [Google Scholar]
- Cullen, F., McLeod, D. J., McLure, R. J., et al. 2024, MNRAS, 531, 997 [NASA ADS] [CrossRef] [Google Scholar]
- Curtis-Lake, E., Carniani, S., Cameron, A., et al. 2023, Nat. Astron., 7, 622 [NASA ADS] [CrossRef] [Google Scholar]
- Dayal, P. 2024, A&A, 690, A182 [NASA ADS] [CrossRef] [EDP Sciences] [Google Scholar]
- Dekel, A., Sarkar, K. C., Birnboim, Y., Mandelker, N., & Li, Z. 2023, MNRAS, 523, 3201 [NASA ADS] [CrossRef] [Google Scholar]
- Donnan, C. T., McLeod, D. J., Dunlop, J. S., et al. 2023, MNRAS, 518, 6011 [Google Scholar]
- Donnan, C. T., McLure, R. J., Dunlop, J. S., et al. 2024, MNRAS, 533, 3222 [NASA ADS] [CrossRef] [Google Scholar]
- Düchting, N. 2004, Phys. Rev. D, 70, 064015 [Google Scholar]
- Eisenstein, D. J., Willott, C., Alberts, S., et al. 2023, ApJS, submitted [arXiv:2306.02465] [Google Scholar]
- Ferrara, A. 2024a, A&A, 684, A207 [NASA ADS] [CrossRef] [EDP Sciences] [Google Scholar]
- Ferrara, A. 2024b, A&A, 689, A310 [NASA ADS] [CrossRef] [EDP Sciences] [Google Scholar]
- Ferrara, A., Pallottini, A., & Dayal, P. 2023, MNRAS, 522, 3986 [NASA ADS] [CrossRef] [Google Scholar]
- Ferrara, A., Pallottini, A., & Sommovigo, L. 2025, A&A, 694, A286 [NASA ADS] [CrossRef] [EDP Sciences] [Google Scholar]
- Finkelstein, S. L., Leung, G. C. K., Bagley, M. B., et al. 2024, ApJ, 969, L2 [NASA ADS] [CrossRef] [Google Scholar]
- Fiore, F., Ferrara, A., Bischetti, M., Feruglio, C., & Travascio, A. 2023, ApJ, 943, L27 [NASA ADS] [CrossRef] [Google Scholar]
- Foreman-Mackey, D. 2016, J. Open Source Softw., 1, 24 [Google Scholar]
- Foreman-Mackey, D., Hogg, D. W., Lang, D., & Goodman, J. 2013, PASP, 125, 306 [Google Scholar]
- Furlanetto, S. R., & Mirocha, J. 2022, MNRAS, 511, 3895 [NASA ADS] [CrossRef] [Google Scholar]
- Gandolfi, G., Rodighiero, G., Bisigello, L., et al. 2025, A&A, submitted (aa54009-25) [arXiv:2502.02637] [Google Scholar]
- Gelli, V., Mason, C., & Hayward, C. C. 2024, ApJ, 975, 192 [NASA ADS] [CrossRef] [Google Scholar]
- Gouttenoire, Y., Trifinopoulos, S., Valogiannis, G., & Vanvlasselaer, M. 2024, Phys. Rev. D, 109, 123002 [Google Scholar]
- Greig, B., & Mesinger, A. 2017, MNRAS, 465, 4838 [NASA ADS] [CrossRef] [Google Scholar]
- Harikane, Y., Ouchi, M., Oguri, M., et al. 2023, ApJS, 265, 5 [NASA ADS] [CrossRef] [Google Scholar]
- Harikane, Y., Nakajima, K., Ouchi, M., et al. 2024, ApJ, 960, 56 [NASA ADS] [CrossRef] [Google Scholar]
- Harvey, T., Conselice, C. J., Adams, N. J., et al. 2025, ApJ, 978, 89 [NASA ADS] [CrossRef] [Google Scholar]
- Haslbauer, M., Kroupa, P., Zonoozi, A. H., & Haghi, H. 2022, ApJ, 939, L31 [NASA ADS] [CrossRef] [Google Scholar]
- Hsiao, T. Y. Y., Abdurro’uf, Coe, D., et al. 2024, ApJ, 973, 8 [NASA ADS] [CrossRef] [Google Scholar]
- Hunter, J. D. 2007, Comput. Sci. Eng., 9, 90 [NASA ADS] [CrossRef] [Google Scholar]
- Hutter, A., Cueto, E. R., Dayal, P., et al. 2025, A&A, 694, A254 [NASA ADS] [CrossRef] [EDP Sciences] [Google Scholar]
- Inayoshi, K., Harikane, Y., Inoue, A. K., Li, W., & Ho, L. C. 2022, ApJ, 938, L10 [NASA ADS] [CrossRef] [Google Scholar]
- Kawasaki, M., Kusenko, A., & Yanagida, T. T. 2012, Physics, 711, 1 [Google Scholar]
- Khlopov, M. Y. 2010, Res. Astron. Astrophys., 10, 495 [Google Scholar]
- Klypin, A., Poulin, V., Prada, F., et al. 2021, MNRAS, 504, 769 [NASA ADS] [CrossRef] [Google Scholar]
- Kokorev, V., Atek, H., Chisholm, J., et al. 2025, ApJ, 983, L22 [Google Scholar]
- Labbé, I., van Dokkum, P., Nelson, E., et al. 2023, Nature, 616, 266 [CrossRef] [Google Scholar]
- Latif, M. A., & Ferrara, A. 2016, PASA, 33, e051 [NASA ADS] [CrossRef] [Google Scholar]
- Li, Z., Dekel, A., Sarkar, K. C., et al. 2024, A&A, 690, A108 [NASA ADS] [CrossRef] [EDP Sciences] [Google Scholar]
- Liu, B., & Bromm, V. 2022, ApJ, 937, L30 [NASA ADS] [CrossRef] [Google Scholar]
- Madau, P., Haardt, F., & Rees, M. J. 1999, ApJ, 514, 648 [CrossRef] [Google Scholar]
- Maiolino, R., Scholtz, J., Curtis-Lake, E., et al. 2024a, A&A, 691, A145 [NASA ADS] [CrossRef] [EDP Sciences] [Google Scholar]
- Maiolino, R., Scholtz, J., Witstok, J., et al. 2024b, Nature, 627, 59 [NASA ADS] [CrossRef] [Google Scholar]
- Marigo, P., Chiosi, C., & Kudritzki, R. P. 2003, A&A, 399, 617 [NASA ADS] [CrossRef] [EDP Sciences] [Google Scholar]
- Mason, C. A., Trenti, M., & Treu, T. 2023, MNRAS, 521, 497 [NASA ADS] [CrossRef] [Google Scholar]
- Matteri, A., Pallottini, A., & Ferrara, A. 2025, A&A, 697, A65 [NASA ADS] [CrossRef] [EDP Sciences] [Google Scholar]
- McKerns, M., & Aivazis, M. 2010, pathos: a framework for heterogeneous computing, https://uqfoundation.github.io/project/pathos [Google Scholar]
- McKerns, M. M., Strand, L., Sullivan, T., Fang, A., & Aivazis, M. A. G. 2012, ArXiv e-prints [arXiv:1202.1056] [Google Scholar]
- McLeod, D. J., Donnan, C. T., McLure, R. J., et al. 2024, MNRAS, 527, 5004 [Google Scholar]
- Mirabel, I. F., Dijkstra, M., Laurent, P., Loeb, A., & Pritchard, J. R. 2011, A&A, 528, A149 [NASA ADS] [CrossRef] [EDP Sciences] [Google Scholar]
- Mirocha, J., & Furlanetto, S. R. 2023, MNRAS, 519, 843 [Google Scholar]
- Morales, A. M., Finkelstein, S. L., Leung, G. C. K., et al. 2024, ApJ, 964, L24 [NASA ADS] [CrossRef] [Google Scholar]
- Morishita, T., Stiavelli, M., Chary, R.-R., et al. 2024, ApJ, 963, 9 [NASA ADS] [CrossRef] [Google Scholar]
- Morishita, T., Mason, C. A., Kreilgaard, K. C., et al. 2025, ApJ, 983, 152 [Google Scholar]
- Murray, S. G., Power, C., & Robotham, A. S. G. 2013, Astron. Comput., 3, 23 [CrossRef] [Google Scholar]
- Naidu, R. P., Oesch, P. A., van Dokkum, P., et al. 2022, ApJ, 940, L14 [NASA ADS] [CrossRef] [Google Scholar]
- Nakama, T., Carr, B., & Silk, J. 2018, Phys. Rev. D, 97, 043525P [Google Scholar]
- Napolitano, L., Castellano, M., Pentericci, L., et al. 2024, ApJ, accepted [arXiv:2410.18763] [Google Scholar]
- Natarajan, P., Pacucci, F., Ricarte, A., et al. 2024, ApJ, 960, L1 [NASA ADS] [CrossRef] [Google Scholar]
- Oesch, P. A., Bouwens, R. J., Illingworth, G. D., Labbé, I., & Stefanon, M. 2018, ApJ, 855, 105 [Google Scholar]
- Padmanabhan, H., & Loeb, A. 2023, ApJ, 953, L4 [NASA ADS] [CrossRef] [Google Scholar]
- Pallottini, A., & Ferrara, A. 2023, A&A, 677, L4 [NASA ADS] [CrossRef] [EDP Sciences] [Google Scholar]
- Parashari, P., & Laha, R. 2023, MNRAS, 526, L63 [NASA ADS] [CrossRef] [Google Scholar]
- Pérez-González, P. G., Costantin, L., Langeroodi, D., et al. 2023, ApJ, 951, L1 [CrossRef] [Google Scholar]
- Pérez-González, P. G., Östlin, G., Costantin, L., et al. 2025, ApJ, submitted [arXiv:2503.15594] [Google Scholar]
- Planck Collaboration VI 2020, A&A, 641, A6 [NASA ADS] [CrossRef] [EDP Sciences] [Google Scholar]
- Pritchard, X., Byrnes, C. T., Lesgourgues, J., & Sharma, D. 2025, ArXiv e-prints, [arXiv:2505.08442] [Google Scholar]
- Raiter, A., Schaerer, D., & Fosbury, R. A. E. 2010, A&A, 523, A64 [NASA ADS] [CrossRef] [EDP Sciences] [Google Scholar]
- Ricotti, M., & Ostriker, J. P. 2004, MNRAS, 352, 547 [Google Scholar]
- Robertson, B., Johnson, B. D., Tacchella, S., et al. 2024, ApJ, 970, 31 [NASA ADS] [CrossRef] [Google Scholar]
- Robertson, B. E., Tacchella, S., Johnson, B. D., et al. 2023, Nat. Astron., 7, 611 [NASA ADS] [CrossRef] [Google Scholar]
- Romeo, M., da Costa, V., & Bardou, F. 2003, Eur. Phys. J. B, 32, 513 [Google Scholar]
- Rubin, S. G., Sakharov, A. S., & Khlopov, M. Y. 2001, Sov. J. Exp. Theoret. Phys., 92, 921 [Google Scholar]
- Sabti, N., Muñoz, J. B., & Kamionkowski, M. 2024, Phys. Rev. Lett., 132, 061002 [Google Scholar]
- Salpeter, E. E. 1964, ApJ, 140, 796 [NASA ADS] [CrossRef] [Google Scholar]
- Schaerer, D. 2002, A&A, 382, 28 [NASA ADS] [CrossRef] [EDP Sciences] [Google Scholar]
- Serpico, P. D., Poulin, V., Inman, D., & Kohri, K. 2020, Phys. Rev. Res., 2, 023204 [NASA ADS] [CrossRef] [Google Scholar]
- Shakura, N. I., & Sunyaev, R. A. 1973, A&A, 24, 337 [NASA ADS] [Google Scholar]
- Sharma, D., Lesgourgues, J., & Byrnes, C. T. 2024, JCAP, 2024, 090 [Google Scholar]
- Shen, X., Hopkins, P. F., Faucher-Giguère, C.-A., et al. 2020, MNRAS, 495, 3252 [Google Scholar]
- Shen, X., Vogelsberger, M., Boylan-Kolchin, M., Tacchella, S., & Naidu, R. P. 2024, MNRAS, 533, 3923 [Google Scholar]
- Somerville, R. S., Yung, L. Y. A., Lancaster, L., et al. 2025, MNRAS, submitted [arXiv:2505.05442] [Google Scholar]
- Sun, G., Faucher-Giguère, C.-A., Hayward, C. C., & Shen, X. 2023, MNRAS, 526, 2665 [NASA ADS] [CrossRef] [Google Scholar]
- Topping, M. W., Stark, D. P., Endsley, R., et al. 2022, ApJ, 941, 153 [NASA ADS] [CrossRef] [Google Scholar]
- Trinca, A., Schneider, R., Valiante, R., et al. 2024, MNRAS, 529, 3563 [NASA ADS] [CrossRef] [Google Scholar]
- van der Walt, S., Colbert, S. C., & Varoquaux, G. 2011, Comput. Scie. Eng., 13, 22 [Google Scholar]
- Van Rossum, G., & de Boer, J. 1991, CWI Quarterly, 4, 283 [Google Scholar]
- Van Rossum, G., & Drake, F. L. 2009, Python 3 Reference Manual (Scotts ValleyValley, CA: CreateSpace) [Google Scholar]
- Virtanen, P., Gommers, R., Oliphant, T. E., et al. 2020, Nat. Methods, 17, 261 [Google Scholar]
- Visbal, E., Haiman, Z., & Bryan, G. L. 2015, MNRAS, 453, 4456 [Google Scholar]
- Wang, B., Fujimoto, S., Labbé, I., et al. 2023a, ApJ, 957, L34 [NASA ADS] [CrossRef] [Google Scholar]
- Wang, Y.-Y., Lei, L., Yuan, G.-W., & Fan, Y.-Z. 2023b, ApJ, 954, L48 [NASA ADS] [CrossRef] [Google Scholar]
- Wang, Z. H., Huang, H. L., & Piao, Y. S. 2025, ArXiv e-prints [arXiv:2501.08542] [Google Scholar]
- Whitler, L., Stark, D. P., Topping, M. W., et al. 2025, ApJ, submitted [arXiv:2501.00984] [Google Scholar]
- Willott, C. J., Desprez, G., Asada, Y., et al. 2024, ApJ, 966, 74 [NASA ADS] [CrossRef] [Google Scholar]
- Xue, Y. Q., Luo, B., Brandt, W. N., et al. 2016, ApJS, 224, 15 [Google Scholar]
- Yan, H., Sun, B., Ma, Z., & Ling, C. 2023, ApJ, submitted [arXiv:2311.15121] [Google Scholar]
- Zavala, J. A., Castellano, M., Akins, H. B., et al. 2025, Nat. Astron., 9, 155 [Google Scholar]
- Ziparo, F., Ferrara, A., Sommovigo, L., & Kohandel, M. 2023, MNRAS, 520, 2445 [NASA ADS] [CrossRef] [Google Scholar]
- Ziparo, F., Gallerani, S., & Ferrara, A. 2025, JCAP, 2025, 040 [Google Scholar]
All Tables
All Figures
|
Fig. 1. Corner plot of MCMC results. Priors on parameters are constant over the intervals reported in Table 1 and are plotted as dashed red lines on the 1D distributions. The parameters’ median, 16th, and 84th percentiles are indicated both above the 1D distributions and as vertical dashed blue lines. |
| In the text | |
|
Fig. 2. UV luminosity functions at redshift z = 11, z = 15, z = 17 (left and right panels), and z = 25 (right panel). Solid lines represent our median predictions (galaxies plus PBH emission) with credible intervals at the 16th and 84th percentiles shown as shaded areas. Dashed lines show the AFM results (Ferrara et al. 2023) for galaxies only. Red hexagons denote z = 17 and 25 observations from Pérez-González et al. (2025); other points represent data in the range 11 ≤ z ≤ 19 from Donnan et al. (2024), McLeod et al. (2024), Robertson et al. (2024), Morishita et al. (2025), Harikane et al. (2024), Kokorev et al. (2025), Yan et al. (2023), Whitler et al. (2025). |
| In the text | |
|
Fig. 3. UV luminosity density (integrated to a limiting magnitude |
| In the text | |
Current usage metrics show cumulative count of Article Views (full-text article views including HTML views, PDF and ePub downloads, according to the available data) and Abstracts Views on Vision4Press platform.
Data correspond to usage on the plateform after 2015. The current usage metrics is available 48-96 hours after online publication and is updated daily on week days.
Initial download of the metrics may take a while.