Fig. 2.
Download original image
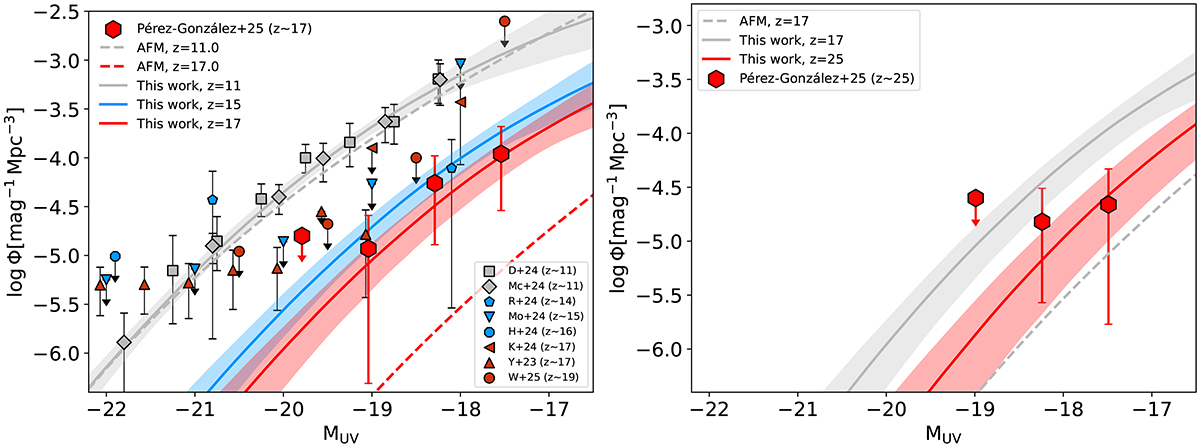
UV luminosity functions at redshift z = 11, z = 15, z = 17 (left and right panels), and z = 25 (right panel). Solid lines represent our median predictions (galaxies plus PBH emission) with credible intervals at the 16th and 84th percentiles shown as shaded areas. Dashed lines show the AFM results (Ferrara et al. 2023) for galaxies only. Red hexagons denote z = 17 and 25 observations from Pérez-González et al. (2025); other points represent data in the range 11 ≤ z ≤ 19 from Donnan et al. (2024), McLeod et al. (2024), Robertson et al. (2024), Morishita et al. (2025), Harikane et al. (2024), Kokorev et al. (2025), Yan et al. (2023), Whitler et al. (2025).
Current usage metrics show cumulative count of Article Views (full-text article views including HTML views, PDF and ePub downloads, according to the available data) and Abstracts Views on Vision4Press platform.
Data correspond to usage on the plateform after 2015. The current usage metrics is available 48-96 hours after online publication and is updated daily on week days.
Initial download of the metrics may take a while.