Fig. 3.
Download original image
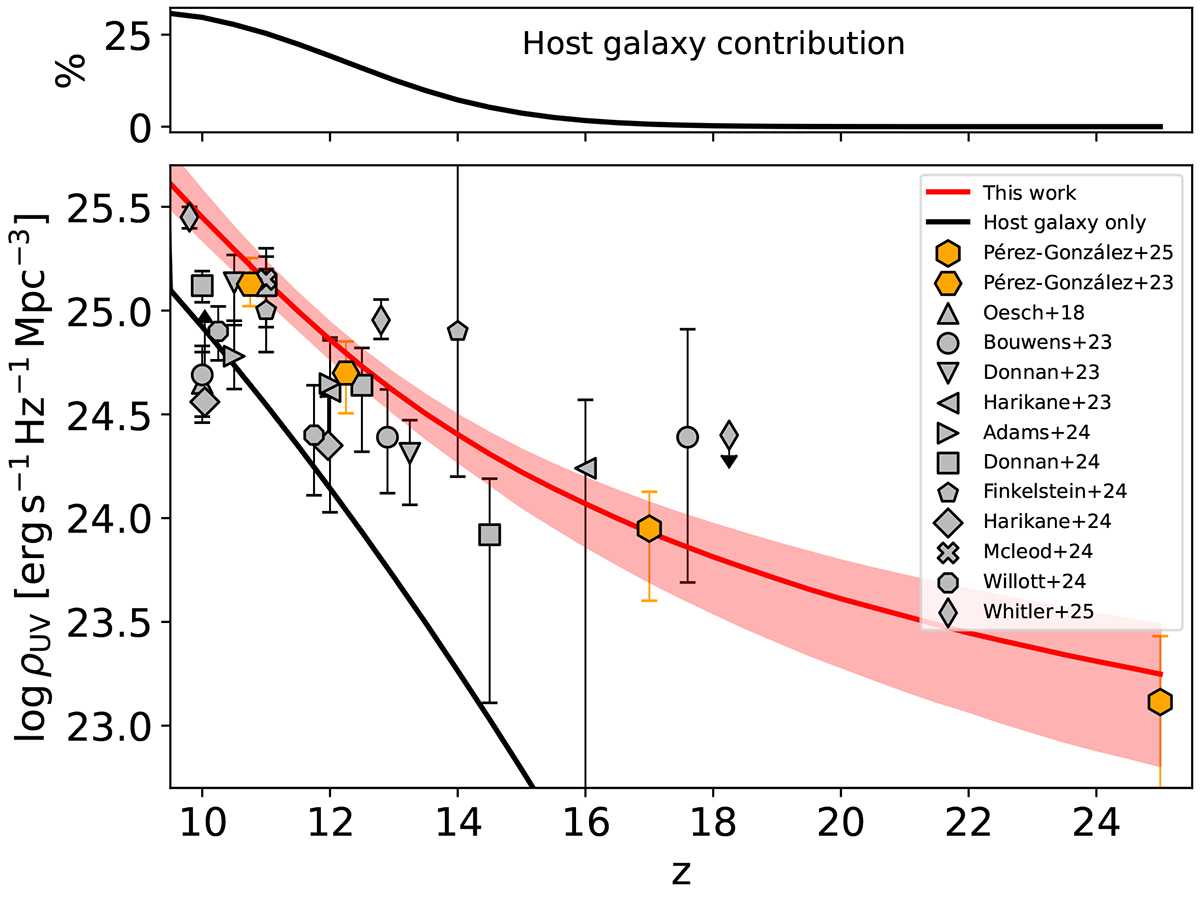
UV luminosity density (integrated to a limiting magnitude ![]() ) evolution with redshift. Our fiducial galaxy plus PBH model is shown by the red curve and the galaxy-only model by the black curve. Shaded areas indicate credible intervals between 16th and 84th percentiles. Orange hexagons represent observational data from Pérez-González et al. (2023, 2025); gray symbols are from Oesch et al. (2018), Bouwens et al. (2023), Donnan et al. (2023), Harikane et al. (2023), Adams et al. (2024), Donnan et al. (2024), Finkelstein et al. (2024), Harikane et al. (2024), McLeod et al. (2024), Willott et al. (2024), Whitler et al. (2025). Top panel: fractional UV luminosity contribution of the host galaxy relative to the total.
) evolution with redshift. Our fiducial galaxy plus PBH model is shown by the red curve and the galaxy-only model by the black curve. Shaded areas indicate credible intervals between 16th and 84th percentiles. Orange hexagons represent observational data from Pérez-González et al. (2023, 2025); gray symbols are from Oesch et al. (2018), Bouwens et al. (2023), Donnan et al. (2023), Harikane et al. (2023), Adams et al. (2024), Donnan et al. (2024), Finkelstein et al. (2024), Harikane et al. (2024), McLeod et al. (2024), Willott et al. (2024), Whitler et al. (2025). Top panel: fractional UV luminosity contribution of the host galaxy relative to the total.
Current usage metrics show cumulative count of Article Views (full-text article views including HTML views, PDF and ePub downloads, according to the available data) and Abstracts Views on Vision4Press platform.
Data correspond to usage on the plateform after 2015. The current usage metrics is available 48-96 hours after online publication and is updated daily on week days.
Initial download of the metrics may take a while.