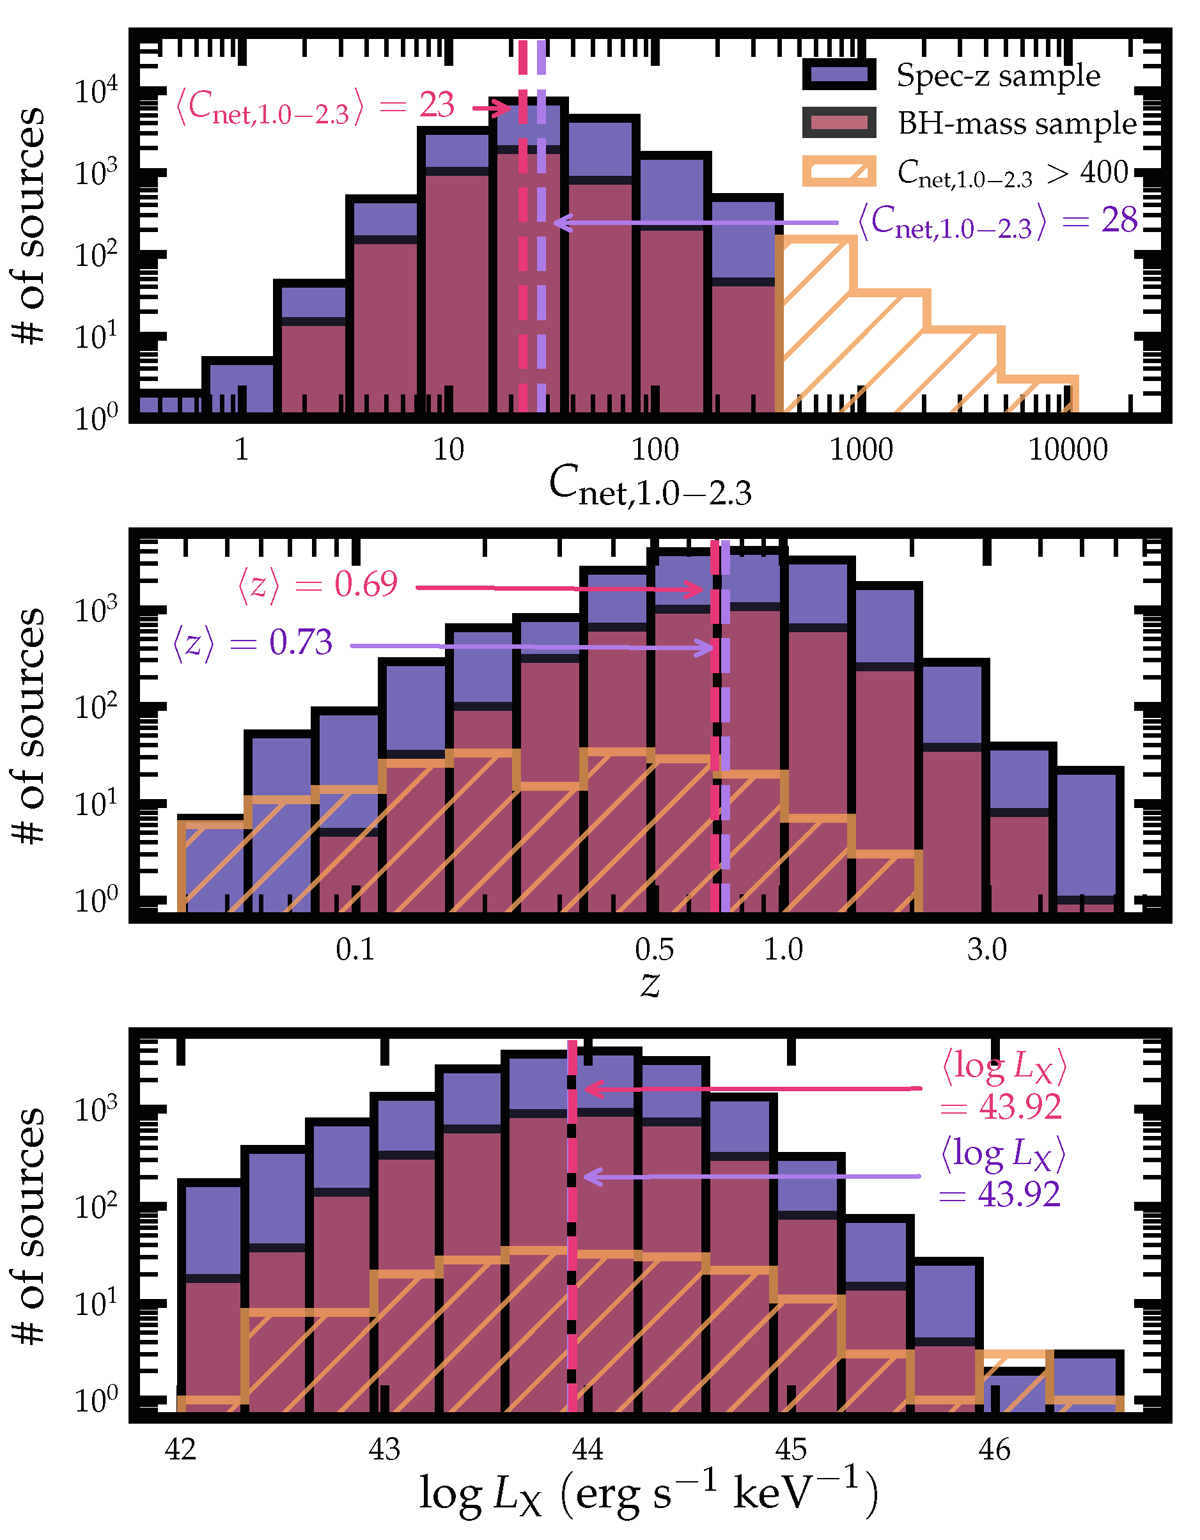
Fig. 1.
Download original image
Distribution of 1.0 − 2.3 keV net counts (top panel), spectroscopic redshifts (middle panel), and 2 keV monochromatic luminosity LX (bottom panel) for our spec-z (purple filled), BH-mass (red filled), and over-bright sources in the spec-z sample (orange hatched), respectively. The median value for spec-z (BH-mass) sample is marked with purple dashed (red dashed) lines.
Current usage metrics show cumulative count of Article Views (full-text article views including HTML views, PDF and ePub downloads, according to the available data) and Abstracts Views on Vision4Press platform.
Data correspond to usage on the plateform after 2015. The current usage metrics is available 48-96 hours after online publication and is updated daily on week days.
Initial download of the metrics may take a while.