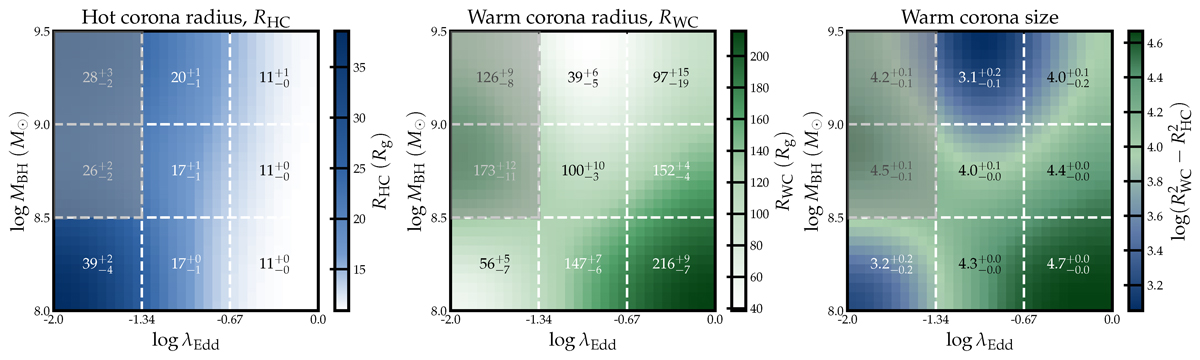
Fig. 10.
Download original image
Evolutionary trend of the hot corona radius RHC (left), warm corona radius RWC (middle), and warm corona “size” log(RWC2 − RHC2) (right) on the 3 × 3 MBH-λEdd grid. The color is linearly interpolated for visualizing trends. The two low λEdd – high MBH bins are grayed out for star-forming contamination (see text for details), except for which the warm corona radius shows a clear increasing trend with increasing λEdd and decreasing MBH. The hot corona radius decreases with increasing λEdd while remains constant for different MBH.
Current usage metrics show cumulative count of Article Views (full-text article views including HTML views, PDF and ePub downloads, according to the available data) and Abstracts Views on Vision4Press platform.
Data correspond to usage on the plateform after 2015. The current usage metrics is available 48-96 hours after online publication and is updated daily on week days.
Initial download of the metrics may take a while.