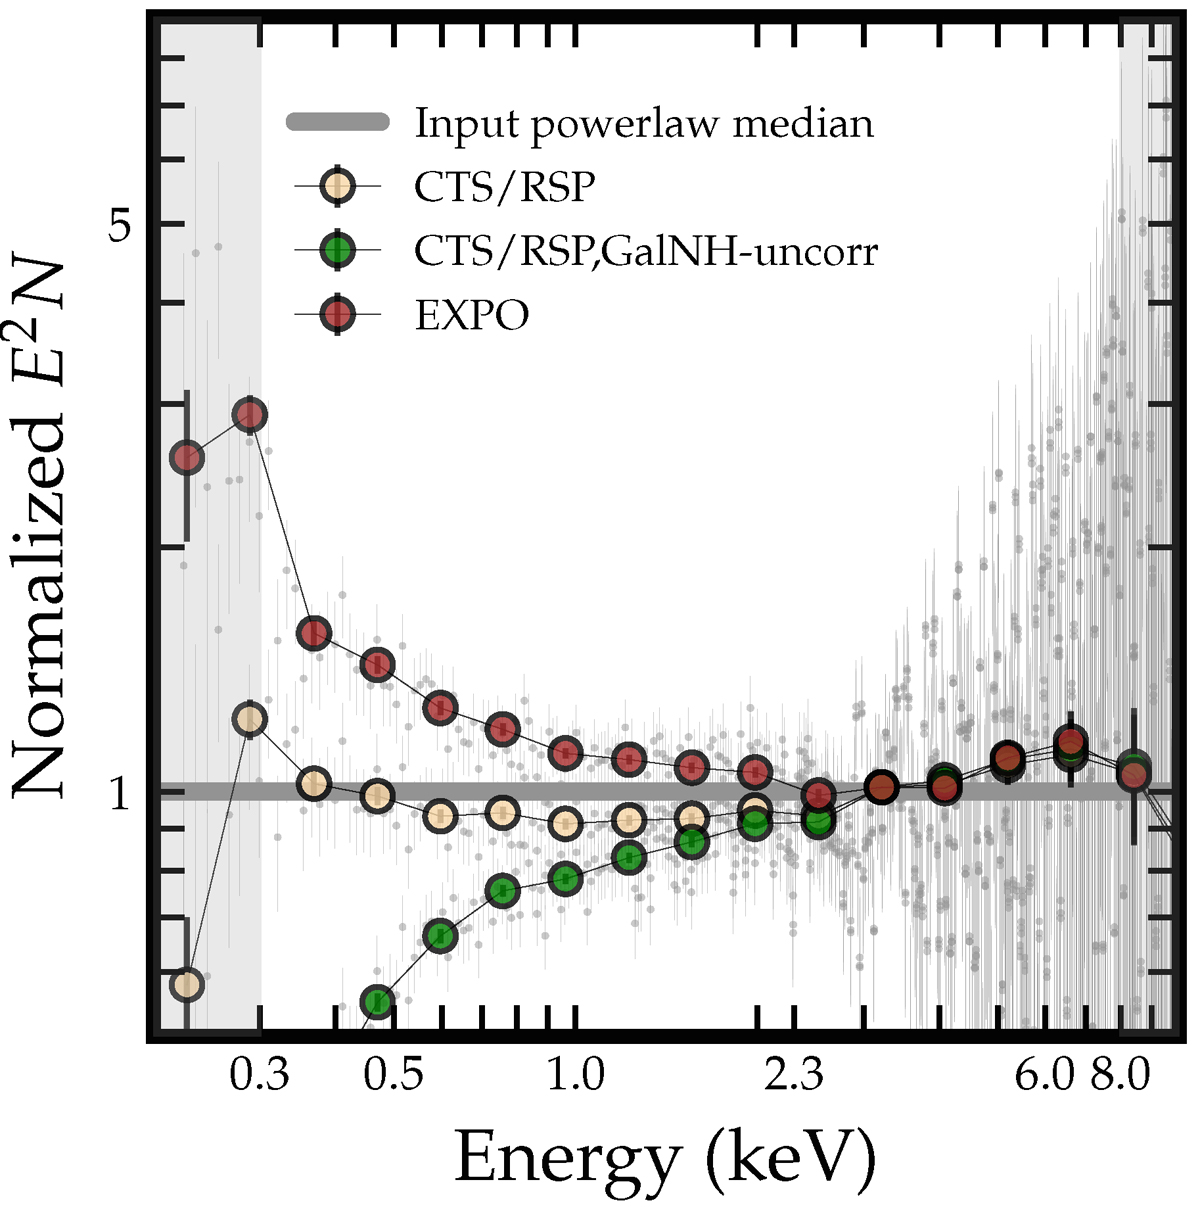
Fig. B.1.
Download original image
Simulation results. For a family of mock power laws with varying photon indices (centered at 2), redshift, Galactic absorption, exposure time, background, and response (all taken from real values), Xstack produces the stacked spectrum (assuming our data-driven response weighting factors) as yellow dots (“CTS/RSP”), resembling the input median power law well. For comparison, we present the stacked spectrum without Galactic absorption correction (green dots, “CTS/RSP,GalNH-uncorr”), and the stacked spectrum taking exposure as response weighting factors (red dots, “EXPO”). They both reproduce much more biased spectral shapes.
Current usage metrics show cumulative count of Article Views (full-text article views including HTML views, PDF and ePub downloads, according to the available data) and Abstracts Views on Vision4Press platform.
Data correspond to usage on the plateform after 2015. The current usage metrics is available 48-96 hours after online publication and is updated daily on week days.
Initial download of the metrics may take a while.