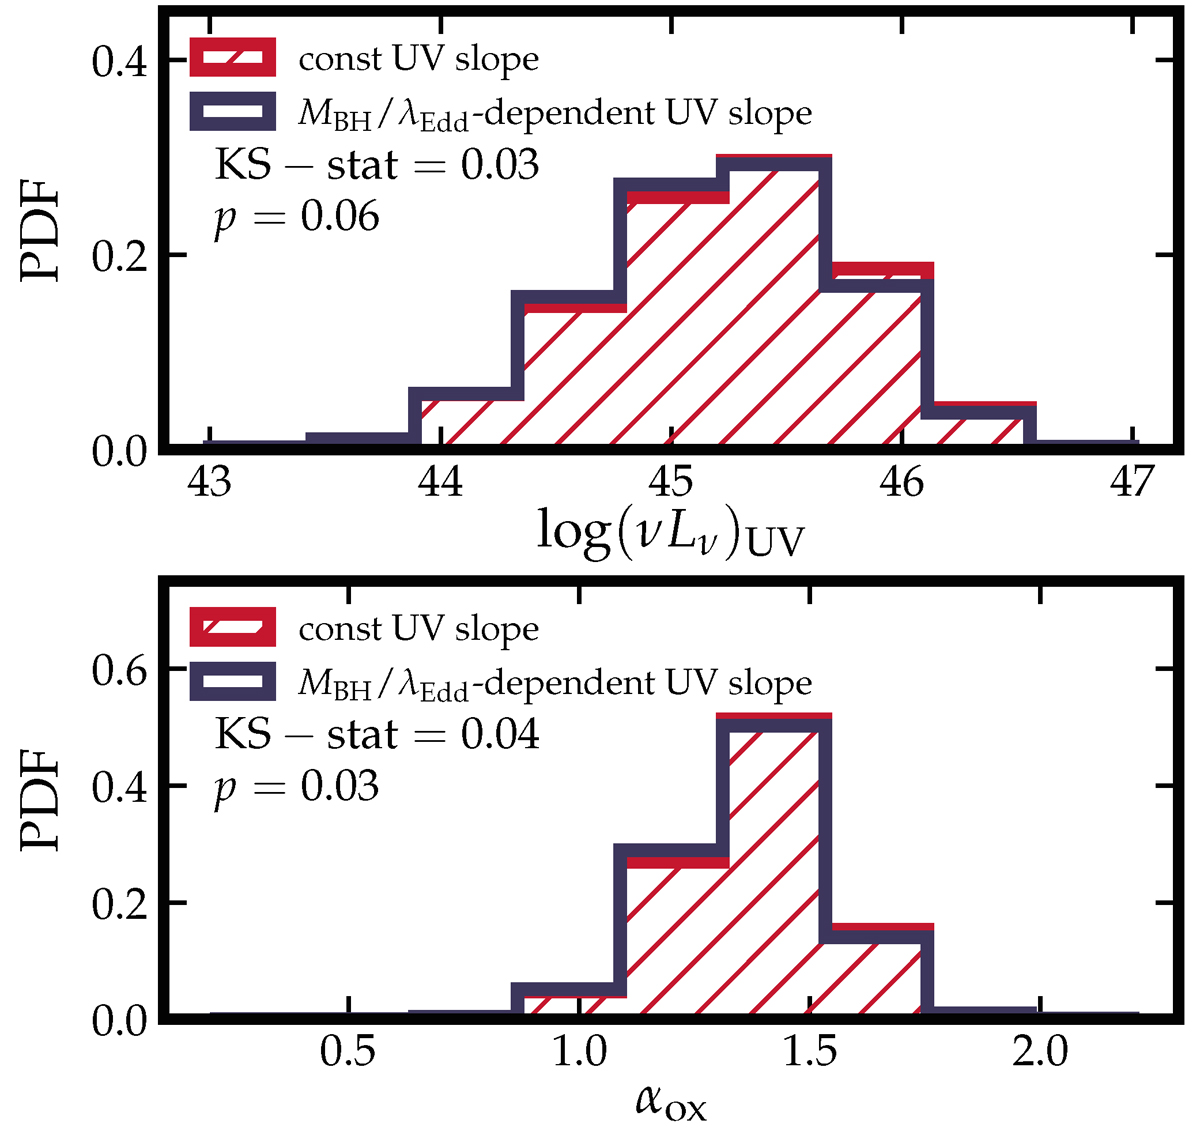
Fig. B.2.
Download original image
Upper panel: Comparison between the UV luminosity derived with K-correction assuming a constant UV SED slope α = −0.65, and that assuming a MBH-λEdd-dependent slope. The KS test statistics as well as p-values are also listed. We generally do not see significant differences between the two distributions. Lower panel: Same as upper panel but comparing αox instead.
Current usage metrics show cumulative count of Article Views (full-text article views including HTML views, PDF and ePub downloads, according to the available data) and Abstracts Views on Vision4Press platform.
Data correspond to usage on the plateform after 2015. The current usage metrics is available 48-96 hours after online publication and is updated daily on week days.
Initial download of the metrics may take a while.