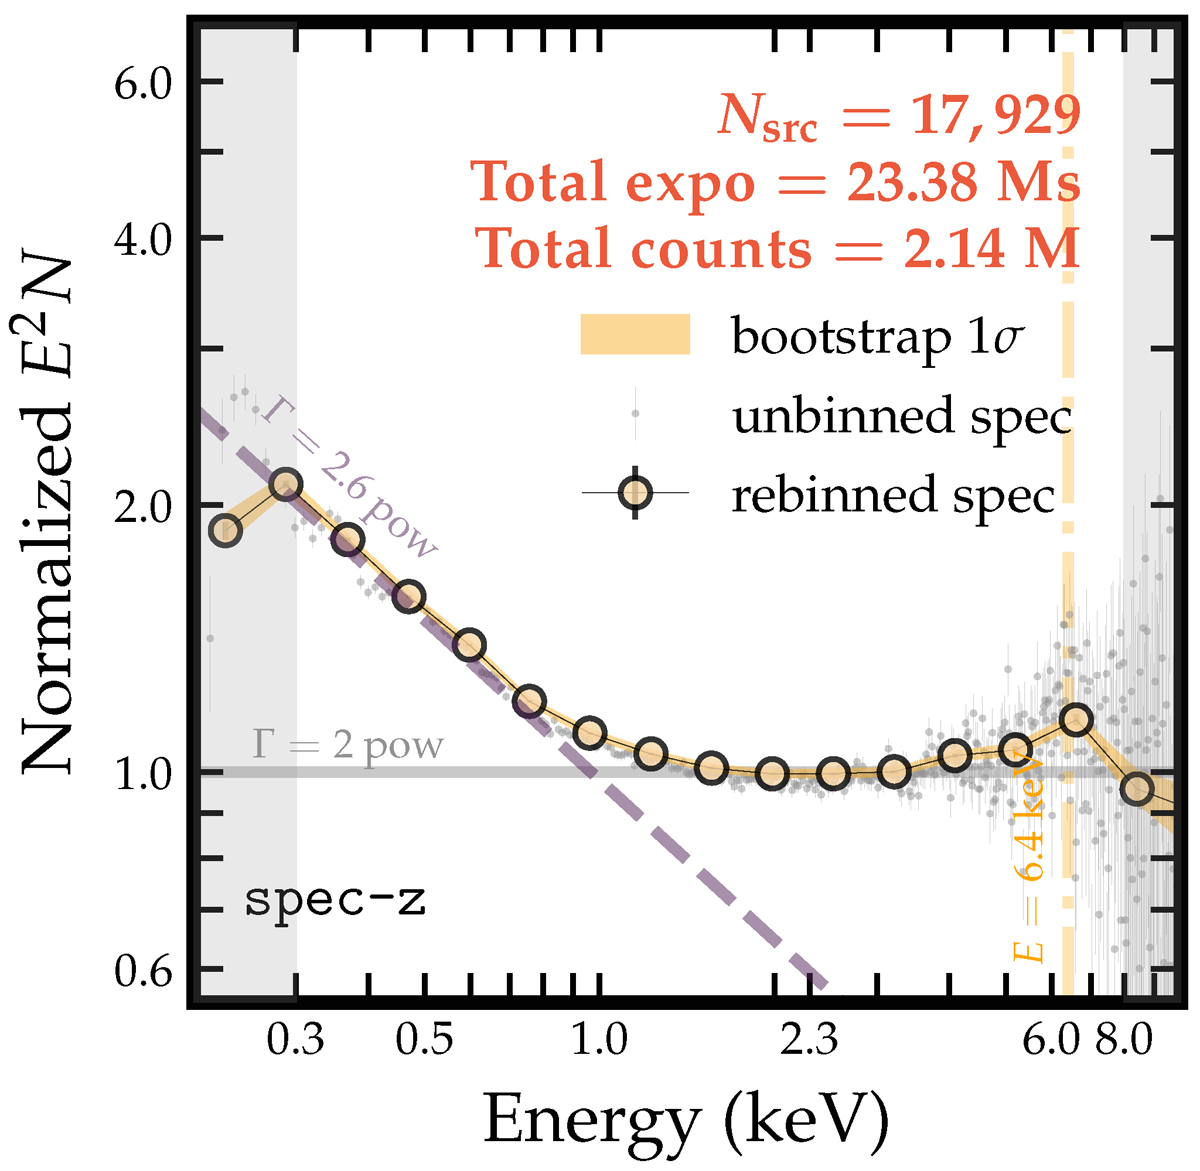
Fig. 3.
Download original image
Summed eROSITA spectrum from 23 Ms of observations (“spec-z” sample). To reveal the intrinsic spectral shape of AGN, the spectrum is divided by the ARF and multiplied by E2 (so the unit proportional to keV2 Counts cm−2 s−1 keV−1 or erg cm−2 s−1), normalized at 4 keV. The gray points are the unbinned data, while yellow circles show a logarithmic rebinning. The yellow shaded area, derived from bootstrapping the sample for 100 times, indicates the 68% uncertainty range of the spectrum from both stacking process and Poisson fluctuation (the plotting routine also applies to Figs. 4–8). Only the spectrum between 0.3 keV and 8 keV is used in this work. Between 1 and 6 keV, the spectrum is approximately linear in this log-log plot, while below, the spectrum bends upwards. Between 6 and 7 keV, a bump is visible despite the relatively larger errorbars. Power laws of typical photon indices are plotted only for visual comparison.
Current usage metrics show cumulative count of Article Views (full-text article views including HTML views, PDF and ePub downloads, according to the available data) and Abstracts Views on Vision4Press platform.
Data correspond to usage on the plateform after 2015. The current usage metrics is available 48-96 hours after online publication and is updated daily on week days.
Initial download of the metrics may take a while.