Fig. 5.
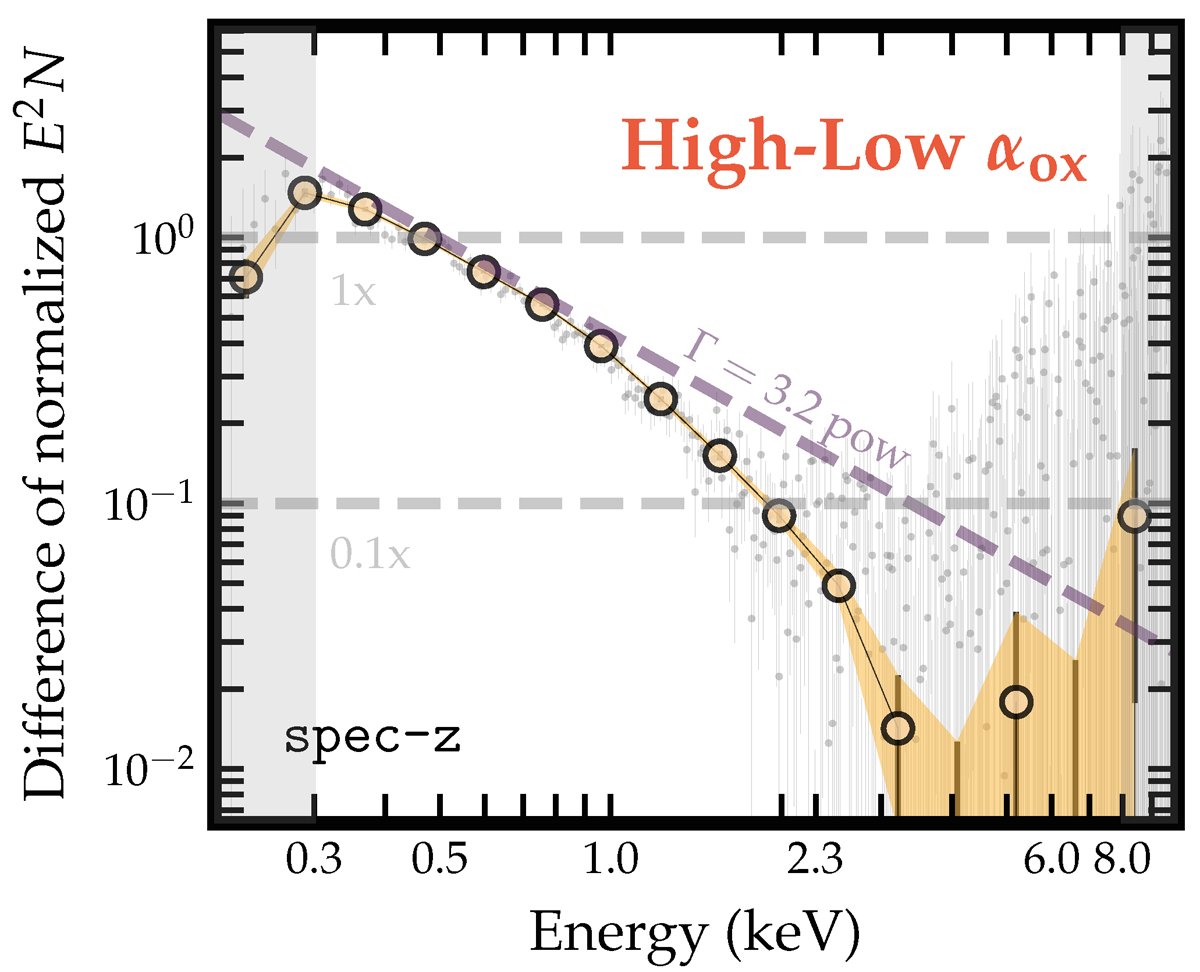
Download original image
Difference spectrum between the highest and lowest αox subgroups from the left panel of Fig. 4 highlighting the spectral shape of the emerging soft excess component. The binned yellow data follow a line in this log-log plot corresponding to a Γ = 3.2 power law (dashed purple line), but fall below beyond 1 keV. The horizontal lines mark where the flux (E2N) of the difference spectrum amounts to 100%, or 10% of the original normalized spectra at 4 keV, where the spectra are normalized. The yellow data points are above the 1x line below 0.5 keV, and below the 0.1x line above 2 keV. Above 3 keV, the difference falls below 1%.
Current usage metrics show cumulative count of Article Views (full-text article views including HTML views, PDF and ePub downloads, according to the available data) and Abstracts Views on Vision4Press platform.
Data correspond to usage on the plateform after 2015. The current usage metrics is available 48-96 hours after online publication and is updated daily on week days.
Initial download of the metrics may take a while.