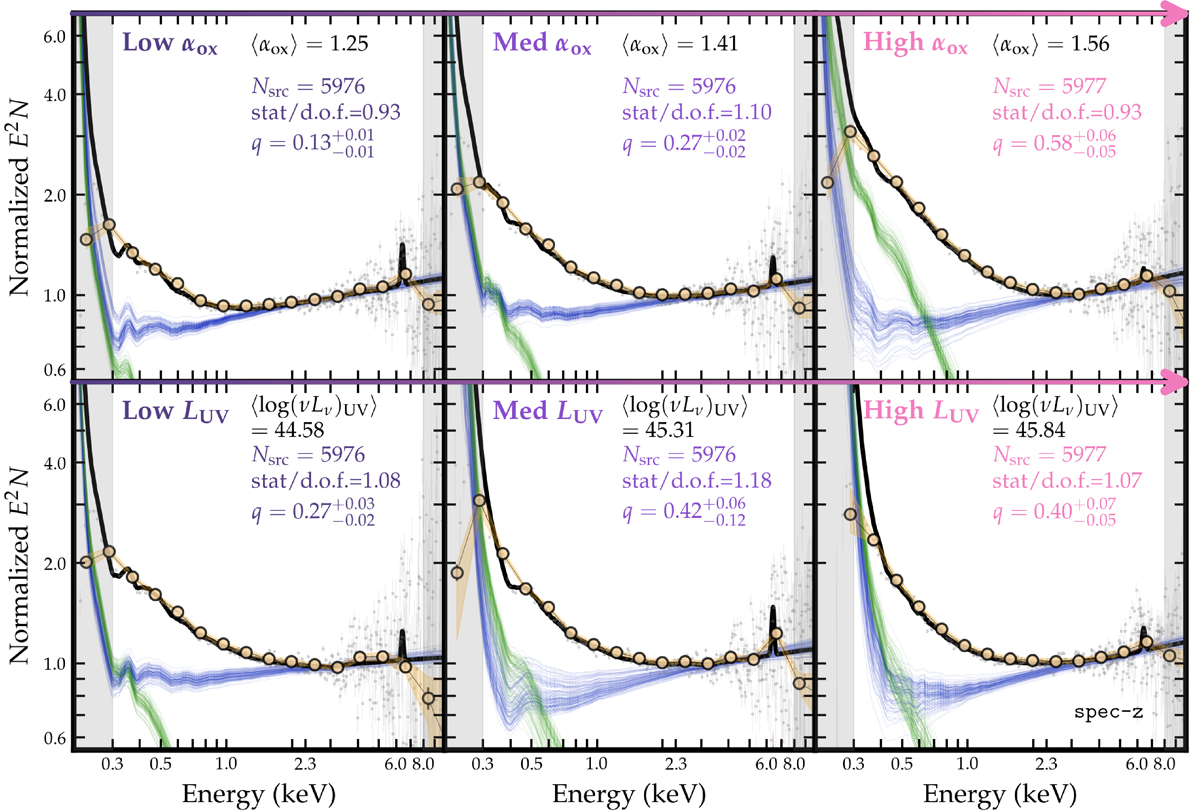
Fig. 6.
Download original image
Fits to stacked spectra (from “spec-z” sample) in equally sized bins of αox (top panels) and LUV (bottom panels). The legend gives the mean value of each subgroup, the number of stacked sources, and the fitting statistics. The soft power law (green) and the hard power law (blue) as well as the sum (black) are shown. Each curve is the best fit to a bootstrap realization of the sample. In the top panels, from the left to right panels, the green curves move upwards. The strengthening of the soft excess is quantified by q with error bars, increasing from 0.13 to 0.58. The bottom panels show fewer changes in the green warm corona component with LUV.
Current usage metrics show cumulative count of Article Views (full-text article views including HTML views, PDF and ePub downloads, according to the available data) and Abstracts Views on Vision4Press platform.
Data correspond to usage on the plateform after 2015. The current usage metrics is available 48-96 hours after online publication and is updated daily on week days.
Initial download of the metrics may take a while.