Fig. 1
Download original image
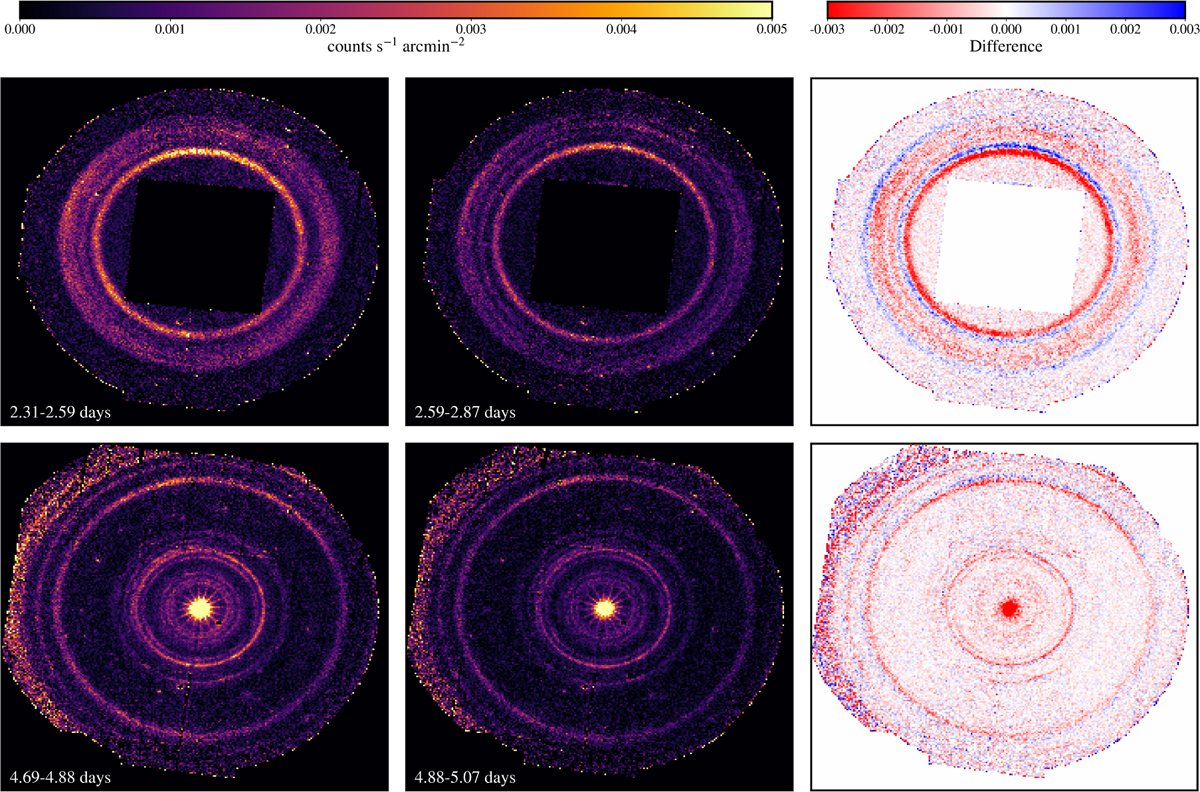
Left and centre: exposure-corrected 0.5–4 keV images observed about six hours apart. Right: difference images highlighting the short-timescale evolution over six hours. the blue-red pattern shows rings undergoing outward motion and subtle fading. The top row shows data from the first epoch, around 2.3 days, from the EPIC MOS1 and MOS2 cameras, and the bottom row shows the second-epoch data from around 4.7 days from EPIC MOS1, MOS2, and pn.
Current usage metrics show cumulative count of Article Views (full-text article views including HTML views, PDF and ePub downloads, according to the available data) and Abstracts Views on Vision4Press platform.
Data correspond to usage on the plateform after 2015. The current usage metrics is available 48-96 hours after online publication and is updated daily on week days.
Initial download of the metrics may take a while.