| Issue |
A&A
Volume 701, September 2025
|
|
|---|---|---|
| Article Number | A65 | |
| Number of page(s) | 12 | |
| Section | Interstellar and circumstellar matter | |
| DOI | https://doi.org/10.1051/0004-6361/202554741 | |
| Published online | 03 September 2025 | |
The optical constants and grain sizes of interstellar dust measured directly using the dust-scattered X-ray halo of GRB221009A
1
Cosmic Dawn Center (DAWN),
Denmark
2
Niels Bohr Institute, University of Copenhagen,
Blegdamsvej 17,
København
2100,
Denmark
★ Corresponding author: This email address is being protected from spambots. You need JavaScript enabled to view it.
Received:
25
March
2025
Accepted:
10
July
2025
Abstract
Context. X-ray scattering is a powerful probe of the grain-size distribution of interstellar dust. Bright transient sources are excellent tools for this because they fade rapidly and only leave the expanding scattered X-ray halo.
Aims. We analysed the dust-scattered X-ray halo data of the unprecedentedly bright γ-ray burst GRB 221009A to measure the grain-size distribution of dust in the Galaxy as well as the complex refractive index m, and use these results to infer the likely dust composition.
Methods. GRB 221009A produced 20 distinct rings, as observed with follow-up observations of the GRB afterglow and scattering halo with the EPIC camera on XMM-Newton. We used anomalous diffraction theory to model the ring brightness as a function of angle.
Results. We constrained the complex refractive index m = n + ik at several x-ray energies and found k1 keV = (2.7 ± 0.7) × 10−4 and 1 − n1 keV = 0.0009 ± 0.0002. This is highly inconsistent with the commonly employed assumptions of the Rayleigh-Gans approximation. These results lie in the expected range for interstellar dust compositions that are dominated by carbon, magnesium silicates, and iron. The absorption results suggest a substantial mass fraction of iron at 35 ± 7%. The Mathis et al. (1977, ApJ, 217, 425) distribution fit returns a maximum grain radius amax = 0.24 ± 0.01 μm; all fits strongly rule out models with ~0.4 μm grains for this sightline. The soft X-ray spectrum of the prompt GRB can also be inferred from the fitting, and the best fit provides a spectral slope that is consistent with the slope of the low-energy side of the best-fit Band model of the directly measured prompt emission. Forcing a different grain size or composition than the best fit results in an inferred prompt spectrum that is different from the observed prompt emission.
Conclusions. We directly measured the grain-size distribution and refractive index of the interstellar dust. The radius of only a very few grains is larger than about ~0.3 μm. The refractive index is consistent with standard average dust compositions, which shows that X-ray scattering is an effective tool for measuring the optical properties of interstellar dust.
Key words: scattering / dust, extinction
© The Authors 2025
 Open Access article, published by EDP Sciences, under the terms of the Creative Commons Attribution License (https://creativecommons.org/licenses/by/4.0), which permits unrestricted use, distribution, and reproduction in any medium, provided the original work is properly cited.
This article is published in open access under the Subscribe to Open model. This email address is being protected from spambots. You need JavaScript enabled to view it. to support open access publication.
1 Introduction
Bright Galactic X-ray sources produce haloes around them through small-angle scattering off dust grains in the interstellar medium (ISM) of the Milky Way (MW) (Overbeck 1965; Rolf 1983). The energy and angular dependence of the haloes provide a means to determine the properties of the dust grains (Mauche & Gorenstein 1986; Predehl & Schmitt 1995; Draine 2003). The uncertainty in the distances to Galactic sources, as well as the necessary brightness of the central sources, often impedes really high-quality measurements of the angular dependence, while observations with a very high signal-to-noise ratio and a good spectral resolution are required to constrain the energy dependence very well (Costantini & Corrales 2022).
Transients allow us to circumvent the problem of the central source brightness because the central source fades before the halo is visible, which results in rings that are observed to expand away from a relatively faint central source on timescales of days to weeks. These rings have been seen around Galactic X-ray binaries (Smith et al. 2002; Heinz et al. 2015; Beardmore et al. 2016), a magnetar (Tiengo et al. 2010), and gamma-ray bursts (GRBs, Vaughan et al. 2004, 2006; Tiengo & Mereghetti 2006; Pintore et al. 2017; Tiengo et al. 2023). GRBs in particular also offer the benefit of being very far away with respect to the MW ISM, which allows us de determine the distances to the dust-scattering layers precisely. GRB X-ray scattering rings therefore permit surprisingly good constraints on the spatial distribution of dust in the line of sight, the column densities, the grain sizes, and even, as we demonstrate in this paper, the optical properties of the dust, if the GRB is sufficiently bright and observed for long enough (e.g. Vaughan et al. 2004; Watson et al. 2006).
The composition of interstellar dust grains is a focus of much research, including the debated solid form of interstellar iron (e.g. Dwek 2016; Zhukovska et al. 2018). High-resolution X-ray spectra permit us to examine the X-ray edges, which enables the study of extended X-ray absorption fine structure (e.g. de Vries & Costantini 2009), the compositional constraints (e.g. Zeegers et al. 2019; Psaradaki et al. 2023), the likely oxidation states (Corrales et al. 2024), and so on. As X-rays are semi-transparent to dust grains, this wavelength regime offers a unique window into the solid phase of the ISM.
GRB 221009A is the brightest GRB ever observed, and it occurred at low Galactic latitude (Williams et al. 2023; Malesani et al. 2025), which produced an exceptional set of expanding X-ray rings that were captured by Swift X-ray telescope (Swift-XRT) and X-ray Multi-Mirror Mission (XMM-Newton) (Tiengo et al. 2023). These data have been used to constrain the radial distance to various dust concentrations (e.g. Vasilopoulos et al. 2023), dust column densities (e.g. Zhao & Shen 2024), and to infer the fluence of the GRB prompt emission in the soft X-rays (Tiengo et al. 2023; Vaia et al. 2025).
In this analysis, we take a different approach and use these observations to constrain the fading of the rings at various energies. This strongly constrains the material properties of the grains, including the size distribution. As far as we are aware, it is also the first direct determination of the complex refractive index of the MW interstellar dust at X-ray energies.
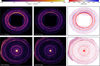 |
Fig. 1 Left and centre: exposure-corrected 0.5–4 keV images observed about six hours apart. Right: difference images highlighting the short-timescale evolution over six hours. the blue-red pattern shows rings undergoing outward motion and subtle fading. The top row shows data from the first epoch, around 2.3 days, from the EPIC MOS1 and MOS2 cameras, and the bottom row shows the second-epoch data from around 4.7 days from EPIC MOS1, MOS2, and pn. |
2 Data and methods
2.1 Data reduction
The evolving X-ray haloes were observed with the XMM-Newton satellite at several epochs (for details see Tiengo et al. 2023): Epoch 1 was on 11 October 2022, at 2.3–2.9 days post-GRB, and only the peripheral CCDs of the EPIC MOS cameras were used for imaging. The observed angular region was 0.12° ≲ θ ≲ 0.22°, which probed scattering on dust layers at distances of 300–1000 pc at these times. Epoch 2 was on 14 October 2022, at 4.7–5.1 days post-GRB, and the EPIC pn and MOS cameras were both used for the imaging with an angular region of θ ≲ 0.22°, which at this time probed scattering on dust at 500–20 000 pc. The prominent dust layers at D ~ 700 pc are shared between epochs 1 and 2, which means that not only is the short-timescale fading of the rings observed, but the ring evolution can be tracked across several days. Later follow-up observations where taken at 21, 23, and 32 days post-GRB. These observations permit constraints on the evolution of the inner rings of the earlier epochs (D ~ 3000 pc in particular). These observations are dominated by a variable particle background, however, so that the derived event-list is subject to large systematic uncertainties. Our analysis thus focusses on the first two epochs, in particular, on the rings shared between epochs, and it was performed as listed below.
We reduced the EPIC MOS and pn data in a standard way using SAS 21.0.0 with the most recent calibration files. We employed no time filtering for epoch 1, but excluded the latter half of the second epoch, which had a strong and variable particle background (see Tiengo et al. 2023).
We extracted events in the energy range 0.5–4 keV in a series of energy bins with bin edges at 0.5, 0.7, 1.0, 1.25, 1.5, 1.75, 2.0, 2.5, 3.0, and 4.0 keV. The signal peaks around 1.2 keV with less constraining power towards lower or higher energies.
We extracted effective area and exposure maps and applied these maps to the events data. We removed point sources that were unrelated to the GRB light and assumed that diffuse light was intrinsically uniform on the sky, which should just be a uniform, constant background in the fit. Fig. 1 shows some exposure-corrected images in different time intervals alongside a difference image to highlight how the rings fade and expand outwards.
As a function of time post-GRB, td, and scattering angle, θ, we made a (θ, td) image (or equivalently, a (D, td) image or (D, θ) image given D = 2ctdθ−2; see below). Fig. 2 shows the dependence of the rings on distance (i.e. the position of the dust layer, its density, and its thickness) and angle. The central panel of Fig. 3 shows the data in (θ, td) space, which is the landscape we used for the fitting.
The width of the point spread functions (PSF) of the EPIC detectors with their full widths at half maxima (FWHMs) ≲ 8″ depend on energy, off-axis angle, and detector type (i.e. MOS or pn). The dominant variation is between detector types. The FWHM of the pn is broader by several dozen percent than that of the MOS detectors. We accounted for these PSF functions in our fits, but the effect of the PSF proved negligible in our analysis. The FWHM increases with increasing off-axis angle in the relevant range from θ = 0.12° to θ = 0.22° by up to 10% for the pn detector, but the variation with energy is subtler and reaches variations at the 5% level up to the highest energies of 4 keV for the largest offsets (Read et al. 2011). The early epochs only include MOS data. The measurements we present here are little affected by these PSF variations because the radial distribution of the radial dust density is a free parameter in our fit and because our binning is coarser than these arcsecond-scale variations (see Sect. 2.3.1). We modelled the dust density at 50 radial distance intervals (logarithmically spaced between 250 pc and 2000 pc), which corresponds to an effective resolution of 15″ and is much greater than the sub-arcsec FWHM variation. We tested this robustness by comparing data with model rings that were convolved in the angular space with either Gaussian or King functions with the angle-, energy- and detector-dependent FWHMs. This produced fits with a similar quality and best-fit parameters consistent within 1σ in grain-type properties, but it caused the dust sheets to become increasingly narrow and prominent to provide a similar effective width of the rings.
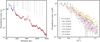 |
Fig. 2 X-ray counts as a function of the two main derived dimensions of our data-set, dust distance (left) and scattering angle (right). The left panel shows the normalised histogram of counts in logarithmic bins of distance, i.e. angular distance from the GRB position transformed using D = 2ctθ−2 (see Eq. (1)). Epochs 1 and 2 are shown in blue and red, respectively, and distinct rings (i.e. dust sheets associated with increased scattering) are indicated with dashed grey lines. The right panel illustrates the angular dependence of the counts, where we report counts relative to 0.04° and marginalised over distances (i.e. by summing counts over various line-of-sight distances divided by the inferred dust density at that distance). This highlights the typical fading of rings with increasing angle, and it shows that for harder photon energies, the rings fade more rapidly with angle. |
2.2 Modelling the X-ray halo
It follows from geometrical arguments that photons scattered on a dust layer travel farther than the direct photons from an X-ray source, and thereby, they experience a time delay. Specifically, photons scattered at time t on a single dust layer at distance D, with an angle θ to the central X-ray source exhibit a time-delay td with respect to the time of the event, t0 (e.g. Overbeck 1965; Xu et al. 1986),
![Mathematical equation: $\[t_d=t-t_0=\frac{D}{2 c} \theta^2.\]$](/articles/aa/full_html/2025/09/aa54741-25/aa54741-25-eq1.png) (1)
(1)
Here, c is the speed of light, and we assumed that the distance to the (Galactic) scattering dust-layer is much smaller than the distance to the extragalactic X-ray source.
The brightness of the X-ray halo is given by (following the derivation in Beardmore et al. 2016)
![Mathematical equation: $\[\begin{aligned}& S_{\text {halo }}(D, t)= \\& \int_{E_1}^{E_2} \int_{a_{-}}^{a_{+}} \int_{t_1}^{t_2} A(E) F\left(E, t-t_d\right) n_g(a, D) \frac{D}{t_d} \frac{d \sigma(E, a, \theta)}{\mathrm{d} \Omega} \mathrm{~d} t_d \mathrm{~d} a \mathrm{~d} E,\end{aligned}\]$](/articles/aa/full_html/2025/09/aa54741-25/aa54741-25-eq2.png) (2)
(2)
where A(E) is the effective area of the telescope, F(E, t) is the X-ray source spectrum, which is integrated over the energy and time ranges of interest for the burst, and dσ(E, a, θ)/dΩ is the differential scattering cross-section. For the dust density along the line of sight, ng(a, D), we assumed identical dust grain sizes and properties for the different Galactic dust-scattering layers. ng(a, D) = dNg(a, D)/da, where Ng(a, D) is the density of dust grains with sizes smaller than a. We assumed a single dust grain-size distribution for all dust sheets and therefore were able to separate ng(a, D) into distance and grain size ng(a, D) = n(a)nd(D). The grain-size distribution was normalised (∫ n(a)da = 1), while nd(D) describes the relative abundance of dust at position D. For the area-corrected observed burst fluence, ![Mathematical equation: $\[\mathcal{F}(E)=\int_{t_{1}}^{t_{2}} A(E) F\left(E, t-t_{\mathrm{d}}\right) ~t_{\mathrm{d}}^{-1} \mathrm{d} t_{\mathrm{d}}\]$](/articles/aa/full_html/2025/09/aa54741-25/aa54741-25-eq3.png) , the integral reduces to
, the integral reduces to
![Mathematical equation: $\[S_{\text {halo }}\left(E_{\mathrm{b}}, D, t\right)=n_d(D) D \int_{E_1}^{E_2} \mathcal{F}(E) \int_{a_{-}}^{a^{+}} n(a) \frac{\mathrm{d} \sigma(E, a, \theta)}{\mathrm{d} \Omega} \mathrm{~d} a \mathrm{~d} E.\]$](/articles/aa/full_html/2025/09/aa54741-25/aa54741-25-eq4.png) (3)
(3)
2.2.1 The timescale of GRB 221009A
Temporal changes in the spectral properties of the burst GRB 221009A are not important to our analysis; neither is the X-ray afterglow. First, the short timescale of the burst (T90 = 289 ± 1s, and a much fainter peak several hundred seconds later; Lesage et al. 2023) compared to the long timescale of the observations (td = 2.31–5.07 days) means that the fractional timescale is short, that is, T90/td ~ (7–15) × 10−3, or an angular separation of the beginning and end of the burst of θ(td) − θ(td + T90) ≲ 0.5″ (given Eq. (1)). This is lower by at least an order of magnitude than the resolution of the PSF and the bins over which the model was evaluated. Second, the high-energy flux from the GRB itself is two orders of magnitude higher during the prompt phase than the afterglow, which suggests that the contribution of the long-lived afterglow to the X-ray scattered dust emission is small. For the purpose of our analysis, we therefore modelled GRB 221009A as a single impulse in time.
Continuous X-ray sources by contrast necessitate careful modelling of PSF effects to deblend various scattering distances, and in addition, longer-lived variable sources require the temporal evolution of the source to be considered as well. On the other hand, short-lived transients such as GRB 221009A scattering on dust sheets provide a remarkably simple diagnostic system. As the rings fade during their expansion, the relative fading of lower- and higher-energy photons only needs to be benchmarked to directly constrain the properties of the scattering layer.
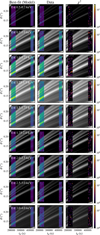 |
Fig. 3 X-ray halo model intensity (left column), observed intensity (middle column), and χ2-comparison (right column) as a function of angle (θ) and post-GRB time (td) in different energy bands. The rings expand with time and, particularly at higher energies, fade with increasing angle. An MRN grain-size distribution (with parameters summarised in Fig. 8) describe the fading of rings within and between epochs. The pixels associated with large deviations from the model (i.e. large χ2) are distributed with no particular correlation to the position of the dust rings. |
2.2.2 Differential scattering cross-section
We used anomalous diffraction theory (ADT) to model the scattering. This is applicable across a wide range of grain sizes and X-ray energies because it only requires |m − 1| ≪ 1 (i.e. refraction of photons at entry and exit is negligible), and a/λ ≫ 1 (i.e. the eikonal approximation, van de Hulst 1957). Previous work has often used the Rayleigh-Gans (RG) approximation (2πa/λ)|m − 1| ≪ 1, and absorption is negligible (k = 0). While the bias of using RG (Smith & Dwek 1998) and the improvements from using ADT (Hoffman & Draine 2016) have been made clear, however, the downstream implications for X-ray grain-size constraints due to the limitations of using the RG approximation have not previously been examined. In this analysis, we employ ADT to obtain robust constraints even for larger grain-sizes and to examine the optical constants of the grains, m = n + ik.
The computational downside of ADT compared to RG is the lack of a simple analytical form, which instead numerically requires evaluating an integral (which for a spherical grain can be expressed in the following form, see Draine & Allaf-Akbari 2006),
![Mathematical equation: $\[\frac{\mathrm{d} \sigma}{\mathrm{~d} \Omega}=(2 \pi / \lambda)^2 a^4\left(\int_0^1\left(1-~\exp ^{i 2(2 \pi a / \lambda)(m-1) \sqrt{1-u^2}}\right) J_0(u 2 \pi a / \lambda) u \mathrm{~d} u\right)^2.\]$](/articles/aa/full_html/2025/09/aa54741-25/aa54741-25-eq5.png) (4)
(4)
This reduces to the RG calculation in the limit of (2πa/λ)|m − 1| ≪ 1, where the differential cross-section for scattering would be (see Mauche & Gorenstein 1986)
![Mathematical equation: $\[\frac{\mathrm{d} \sigma}{\mathrm{~d} \Omega} \propto a^6|m-1|^2\left(\frac{j_1(x)}{x}\right)^2\left(1+~\cos ^2 \theta\right),\]$](/articles/aa/full_html/2025/09/aa54741-25/aa54741-25-eq6.png) (5)
(5)
where ![Mathematical equation: $\[x=\frac{4 \pi a}{\lambda} ~\sin~ \left(\frac{\theta}{2}\right)\]$](/articles/aa/full_html/2025/09/aa54741-25/aa54741-25-eq7.png) , and the angular dependence on the grain size and photon energy is given by the term
, and the angular dependence on the grain size and photon energy is given by the term ![Mathematical equation: $\[\left(\frac{j_{1}(x)}{x}\right)^{2}\left(1+~\cos ^{2} \theta\right)\]$](/articles/aa/full_html/2025/09/aa54741-25/aa54741-25-eq8.png) , where j1 is the spherical Bessel function of first order. As noted above, the RG approximation assumes that i) the complex refractive index is close to unity |m − 1| ≪ 1, and ii) (2πa/λ)|m − 1| ≪ 1, which is more restrictive in the X-ray context. For X-ray wavelengths, the dust grains that predominantly cause the scattering are larger than the wavelength of the radiation, that is, 2πa/λ ≫ 1, but even then, the latter inequality is generally satisfied because the refractive index is very close to unity, that is, |m − 1| ≪ 1. To investigate grain-size distributions, and in particular, to constrain the abundance of larger grains, that is, 0.2–1 μm grains, or examine the impact of various refractive indexes, this falls outside the range of applicability of the RG approximation. Specifically, RG fails towards lower energies (E ≲ 1 keV for a+ = 0.2 μm) or at even higher energies when larger grains are present (Smith & Dwek 1998).
, where j1 is the spherical Bessel function of first order. As noted above, the RG approximation assumes that i) the complex refractive index is close to unity |m − 1| ≪ 1, and ii) (2πa/λ)|m − 1| ≪ 1, which is more restrictive in the X-ray context. For X-ray wavelengths, the dust grains that predominantly cause the scattering are larger than the wavelength of the radiation, that is, 2πa/λ ≫ 1, but even then, the latter inequality is generally satisfied because the refractive index is very close to unity, that is, |m − 1| ≪ 1. To investigate grain-size distributions, and in particular, to constrain the abundance of larger grains, that is, 0.2–1 μm grains, or examine the impact of various refractive indexes, this falls outside the range of applicability of the RG approximation. Specifically, RG fails towards lower energies (E ≲ 1 keV for a+ = 0.2 μm) or at even higher energies when larger grains are present (Smith & Dwek 1998).
2.3 Modelling and fitting procedure
Throughout the analysis, we simultaneously fitted the radial dust-density distribution (see Sect. 2.3.1), the grain-size distribution (see Sect. 2.3.2), and the refractive index (see Sect. 2.3.3). Here, the grain properties determine the fading of the rings, while the dust distribution sets the relative intensities of the rings. As our analysis uses the fractional or relative fading of the rings, it is agnostic to the fluence of the original GRB. The input spectral shape can be inferred from the observed scattering-ring spectra for specific grain properties, however (see Sect. 3.1).
In general, χ2 values should be interpreted in the context of the 5922 data points of S (Eb, D, t) we modelled. For the numerous variables encompassing i) radial dust (50–100 parameters), ii) the grain-size distribution (3–5 parameters), and iii) the refractive index (0–4 parameters), this typically implies that the number of degrees of freedom is ~5800 and that a high dimensional parameter space must be surveyed. This exploration was achieved using the emcee MCMC sampler (Foreman-Mackey et al. 2013) on the lmfit Minimizer object for χ2 minimisation (Newville et al. 2016), where we ran hundreds of walkers over 10000 steps (i.e. many auto-correlation timescales) to find an optimal minimum. This amounted to several million parameter evaluations of Smodel(Eb, D, t). We generally assumed flat priors on the parameters (we assumed positive values of physical quantities). The sole exception (where we did not allow a free fit of all parameters) was the case where we enforced the RG approximation (e.g. k = 0, n − 1 ~ 0) to show that this approximation is statistically disfavoured (see rows 1–2 in Table 1).
2.3.1 Radial dust distribution
We parameterised the radial dust distribution nd(D) at 50 logarithmically spaced radial bins between 250 and 2200 pc and evaluated by linear interpolation between these points, which provided sheets similar to those found by Tiengo et al. (2023). We imposed no regularisation, but found a strong correlation between neighbouring points that showed spatial correlations in the line-of-sight extent of the dust sheets. Cubic-interpolation or doubling the number of evaluated points did not yield significant improvements (see Fig. 4). The dust distribution has little influence on the main thrust of our analysis, which is concerned with how the scattering decreases for a given distance and increasing offset angle. As mentioned previously, we also accounted for energy-, angle-, and detector-dependent PSF-effects, which ultimately did not significantly improve the fit or changed the best-fit grain-type properties markedly because the primary effect of including PSF effects is to find somewhat narrower dust sheets in the fit, with little impact on the grain properties. Lastly, we also tried to include observations with a smaller offset angle from the second epoch (i.e. <0.12°), which provide constraints on the radial dust distribution at greater distances. The combination of large distances and the short probed time-baseline (relative to the total time post-event) meant that the angular evolution was slower, however, which meant that the grain properties are not more strongly constrained by including all angles. To avoid fitting even more distance density parameters, we did not include these data in our final analysis.
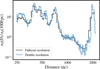 |
Fig. 4 Radial dust density landscape fitted for the fiducial computation (black) and for a radial resolution twice higher (blue). The increased resolution allows for greater constraints on the radial distribution of dust, but is not important in measuring the energy or azimuthal fading of a ring at a given distance. |
2.3.2 Dust grain-size distribution
For the dust grain-size distribution, we implemented various prescriptions, and our fiducial model was the Mathis et al. (1977, MRN) distribution, which is characterised by a power-law distribution from the smallest grains, a−, to the largest, a+,
![Mathematical equation: $\[n(a)=N_g a^{-q}.\]$](/articles/aa/full_html/2025/09/aa54741-25/aa54741-25-eq9.png) (6)
(6)
We also allowed for an exponential cut-off for grain sizes a > a+, with control of the steepness of the cut-off, with n(a) = Nga−qf(a, ac), where f(a, ac) = exp(−(a − a+)/ac) for a > a+ and f(a) = 1 for a ≤ a+. For the exponential cut-off version, all parameters (e.g. ac, a+, q) were free to vary, but a steep cut-off (small ac) was preferred by the data (see Sect. 3.2). Additionally, to examine the constraining power on large grains, we also introduced a lognormal component in which the amplitude, centroid, and width were free to vary, that is, were not necessarily a monotonic extension of the MRN distribution of grain sizes.
A more complex distribution was laid out in Weingartner & Draine (2001), who reported a lognormal distribution for carbon macromolecules and two separate power-law distributions to describe silicate and carbonaceous grains, that is, ns(a) = Ng,sa−qs with a+,s and nc(a) = Ng,ca−qc with a+,c. In contrast, the recent analysis of Hensley & Draine (2023) motivated by polarisation data argued for a single composite astrodust material (for grains larger than ~0.02 μm), which, while characterised by a complex size distribution, notably includes 0.2–0.7 μm grains for a mean Milky Way sight line. Therefore, we also examined the goodness of fit for this grain-size distribution model, both with the fiducial grain-size distribution from Hensley & Draine (2023) and with parameters that were free to vary. This parametrisation employed various lognormal distributions for small grain sizes (which are too small to affect scattering rings, however) alongside a complex fifth-order polynomial to approximate log(n(a)) towards larger grains,
![Mathematical equation: $\[n_{\mathrm{HD}}(a) \propto \exp \left[\sum_{i=1}^5 A_i ~\ln \left(\frac{\mathrm{a}}\AA\right)\right],\]$](/articles/aa/full_html/2025/09/aa54741-25/aa54741-25-eq10.png) (7)
(7)
where A1 = −3.40, A2 = −0.807, A3 = 0.157, A4 = 7.96 × 10⁻³, and A5 = −1.68 × 10⁻³ for the fiducial Hensley & Draine (2023) size distribution. We also considered this model, but fitted for these polynomial coefficients (labelled HD*; see rows 3–4 in Table 1).
Model comparison using various dust grain-size distributions [(MRN Mathis et al. 1977), (HD Hensley & Draine 2023)] and various assumptions for refractive index models (e.g. ADT or RG).
2.3.3 Modelling the refractive index
Using the ADT framework, we constrained the best-fit real (n) and imaginary (k) parts of the refractive index. These can be fit independently at each energy bin or with a spectral model, for example by fitting the energy dependence of the refractive index with a power-law approximation in energy (i.e. k(E) = k1 keVE−kα and 1 − n(E) = (1 − n1 keVE−nα, where E is the photon energy in keV). These power-law prescriptions are expected to be reasonable approximations for grain compositions such as MgFeSiO4, outside of the localised effects of the atomic absorption edges. We therefore attempted to constrain the refractive index at energies at which the rings are observed in both early and late epochs (i.e. 0.5–4 keV).
In addition to parametrising the real and imaginary components of the refractive index as power laws, we also tested various linear combinations of astrophysically motivated grain types: carbon grains, SiC, metallic iron, olivines (i.e. Mg2SiO4, MgFeSiO4, Fe2SiO4), pyroxenes (e.g. MgSiO3), and astronomical silicates (Draine & Hensley 2021). By employing linear combinations of these compounds and by treating the refractive index with the mass fractional abundance of each grain type as a free parameter, we explored potential constraints on the mixing of different compositions (see rows 5–7 in Table 1, or Sect. 3.4).
3 Results
In all models (see Table 1), the best-fit reduced chi-squares are ![Mathematical equation: $\[\chi_{\nu}^{2} \sim 1.19-1.42\]$](/articles/aa/full_html/2025/09/aa54741-25/aa54741-25-eq13.png) , which is substantially above unity. This suggests that there is room for further improvements to the data reduction and likely to the modelling as well. The required improvements are not obvious from the fit residuals, however, and χ2(Eb, D, t) and any particular energy band, time, or distance (or equivalently, offset angle) are not strongly correlated. We speculate that the modelling might be improved in future work by i) using late-time imaging for a detailed background subtraction of point sources and diffuse light, ii) implementing a higher spatial resolution of dust sheets, and iii) a greater resolution or even simultaneous modelling of the landscape in energy, distance, and time (instead of discretising Smodel(Eb, D, t) in bins). Nevertheless, the change in Δχ2 is about a thousand when we compare our best-fit model with free-to-vary n and k to specific mineral compositions and when we compare the grain-size distributions (see Table 3). This highlights the strong constraining power of this dataset.
, which is substantially above unity. This suggests that there is room for further improvements to the data reduction and likely to the modelling as well. The required improvements are not obvious from the fit residuals, however, and χ2(Eb, D, t) and any particular energy band, time, or distance (or equivalently, offset angle) are not strongly correlated. We speculate that the modelling might be improved in future work by i) using late-time imaging for a detailed background subtraction of point sources and diffuse light, ii) implementing a higher spatial resolution of dust sheets, and iii) a greater resolution or even simultaneous modelling of the landscape in energy, distance, and time (instead of discretising Smodel(Eb, D, t) in bins). Nevertheless, the change in Δχ2 is about a thousand when we compare our best-fit model with free-to-vary n and k to specific mineral compositions and when we compare the grain-size distributions (see Table 3). This highlights the strong constraining power of this dataset.
Tables 2 and 3 present the best-fit grain properties, the relative intensity in the rings, and the radial dust-density distribution for the best-fit model (e.g. MRN with ADT). As mentioned previously, the scattering analysis we present is not directly sensitive to the fluence of the input GRB because we only considered the energy-dependent fading of the rings with increasing offset angle. Consequently, the radial dust distribution is shown normalised to the value at 1 kpc, and the energy dependence is reported relative to 1 keV.
Best-fit grain properties and relative incident flux in various bands with 1σ uncertainties.
Dust density nd(D)/nd(1 kpc) at various distances D.
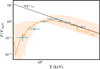 |
Fig. 5 Input spectrum of the GRB prior to scattering on Galactic dust sheets. The blue error bars indicate the inferred input X-ray signal for the best-fit model grain-properties. For comparison, the expected shape of a power-law decline of the prompt signal (dashed black line) with substantial MW and host galaxy absorption found in previous work (e.g. NH ~ 3 × 10²¹−2 × 1022 cm−2; Williams et al. 2023; Vaia et al. 2025) follow the predicted input spectrum suggested by the best-fit grain properties. |
3.1 Reconstructing the GRB prompt spectrum
We allowed complete freedom in the relative intensity of the input flux in the different X-ray energy bands. These energy normalisations therefore do not affect the accuracy with which the other parameters are retrieved. Their values are interesting, however, because they can shed light on the prompt GRB spectrum. The direct light of the GRB itself and the scattered component of the rings both travel through largely the same sheets of dust, which results in a similar total X-ray absorption. They differ in that the prompt GRB spectrum is not modified by the energy-dependent efficiency of scattering by the grains. The observed ring spectrum, given the true grain properties, should thus reproduce the prompt spectrum of the GRB as it would have been observed in soft X-rays.
Based on the different constraints on the grain properties enumerated below, we therefore compared how closely our inferred prompt spectrum matched the spectrum measured from the GRB itself (e.g. Lesage et al. 2023; Williams et al. 2023). In particular, the input flux in each energy band increased towards higher energies up to 1.5 keV, after which the flux decreased as a power law (Fig. 5). This flux is reported in units of counts, was normalised to the bandpass width of the energy bin, and we report it relative to the flux at 1 keV because we are agnostic to the original fluence of the GRB spectrum. Nevertheless, the inferred input spectrum matches the expectation of a power law with significant host and Milky Way absorption (e.g. F(E) ∝ E−1.6 with absorption of roughly NH ~ 1022 cm−2 or see Fig. 5 in Williams et al. 2023).
For an MW absorption (NH ≈ 7(±1) × 1021 cm−2 from the Galactic dust column on this sight line) and host absorption (NH ≈ 4 × 1021 cm−2) (e.g. Tiengo et al. 2023; Vaia et al. 2025), the derived intrinsic GRB power-law slope is Γ = 1.5 ± 0.2 for the best-fit MRN distribution. This fitted incident X-ray spectrum is consistent with the power-law index inferred for the low-energy side of the Band model fit to times close to the peak of the prompt emission (e.g. Lesage et al. 2023). Despite this agreement, we still chose to leave the analysis agnostic with complete freedom to vary the spectral shape. For comparison, Γ = 1.2 ± 0.2 is found in the HD* model, which might suggest that this model might be disfavoured even more than the relatively larger χ2 would suggest. The spectrum at the peak of the prompt emission in the soft X-ray was not directly measured, however. It is likely that even stronger constraints on the grain parameters could be obtained in the future by imposing a prior on F(E) based on the observed prompt emission and standard GRB models.
 |
Fig. 6 Dust grain-size distribution, n(a), showing the posterior probability distribution of fits to the GRB 221009A X-ray rings, with a model based on the MRN (Mathis et al. 1977) distribution with an additional large-grain size lognormal component. The proposed grain-size distribution of Hensley & Draine (2023) is shown for comparison, and the best-fit parameters of this parametrisation is shown as well. The dotted line indicates the 95th percentile (2σ) upper envelope on the grain-size distribution. Strong limits can be placed on the population of a ~ 0.4 μm grains, which must be several orders of magnitude less abundant than grains with a ~ 0.2 μm. Because of the lack of grains at this size, the Hensley & Draine (2023) grain-size distribution is disfavoured for this sight line. Larger grains (≳1 μm) are not strongly constrained as these predominantly scatter at smaller angles than we measure with these data. |
3.2 Limits on the population of large grains
Because the differential scattering cross-section strongly depends on the grain size (![Mathematical equation: $\[\frac{\mathrm{d} \sigma}{\mathrm{d} \Omega} \propto a^{6}\]$](/articles/aa/full_html/2025/09/aa54741-25/aa54741-25-eq14.png) for RG, but slightly modified in ADT), any population of large grains is strongly constrained by the angular fading of the rings. Fitting a single power-law MRN distribution, we found a maximum grain size a+ = 0.24 ± 0.01. An exponential cut-off suggests a+ + ac < 0.28 at the 2σ confidence level. Fig. 6 shows the distribution of n(a) inferred from a fitting with an MRN grain-size distribution with an additional lognormal distribution (the amplitude, width, and centroid were free to vary) intended to explore the parameter space of potentially large grains. The resulting 2σ upper limit on n(a) is shown and highlights that while grains larger than 1 μm are not ruled out by the fading rings, grains around 0.4 μm have stringent upper bounds. This strongly suggests that a significant abundance of larger grain sizes is disfavoured along this sight line in the MW. This sight line thus apparently disagrees with the independent lines of evidence, such as modelling in Hensley & Draine (2023), which suggested some population of grains at these sizes. Fitting the landscape of fading rings with a Hensley & Draine (2023) distribution (which includes a limited population of 0.3–0.7 micron grains; see Fig. 6) gives a χ2 = 8302 compared with χ2 = 6950 for the aforementioned MRN distribution. Allowing the parameters within the parametrisation of Hensley & Draine (2023) to be free improves the fit, but not sufficiently so to reach the goodness of fit provided by the more rapid cessation of grains greater than 0.3 μm.
for RG, but slightly modified in ADT), any population of large grains is strongly constrained by the angular fading of the rings. Fitting a single power-law MRN distribution, we found a maximum grain size a+ = 0.24 ± 0.01. An exponential cut-off suggests a+ + ac < 0.28 at the 2σ confidence level. Fig. 6 shows the distribution of n(a) inferred from a fitting with an MRN grain-size distribution with an additional lognormal distribution (the amplitude, width, and centroid were free to vary) intended to explore the parameter space of potentially large grains. The resulting 2σ upper limit on n(a) is shown and highlights that while grains larger than 1 μm are not ruled out by the fading rings, grains around 0.4 μm have stringent upper bounds. This strongly suggests that a significant abundance of larger grain sizes is disfavoured along this sight line in the MW. This sight line thus apparently disagrees with the independent lines of evidence, such as modelling in Hensley & Draine (2023), which suggested some population of grains at these sizes. Fitting the landscape of fading rings with a Hensley & Draine (2023) distribution (which includes a limited population of 0.3–0.7 micron grains; see Fig. 6) gives a χ2 = 8302 compared with χ2 = 6950 for the aforementioned MRN distribution. Allowing the parameters within the parametrisation of Hensley & Draine (2023) to be free improves the fit, but not sufficiently so to reach the goodness of fit provided by the more rapid cessation of grains greater than 0.3 μm.
The bounds on the grain population around 0.4 μm predominantly come from the lower-energy photons. For instance, 0.5–1 keV photons forward-scatter strongly off 0.2–0.5 μm grains at ~0.1°, which would fade substantially when the rings expand to ~0.2°. The rather limited fading of the lower-energy photons that we observed rules out families of models with grains of these sizes, however. The forward-scattering from micron-size grains or larger is confined to angles θ < 0.1° for the energies we analysed here, meaning that we cannot constrain these much larger grains very strongly.
3.3 Constraints on the refractive index using anomalous diffraction theory
Fig. 7 shows the resulting constraints on k(E) and n(E) inferred from the fading rings of GRB 221009A using ADT. The bestfit normalisation in the complex refractive index is k1 keV = (2.7 ± 0.7) × 10−4 and n1 keV = 0.9991 ± 0.0002 in linear units. For comparison, the refractive indices from Henke et al. (1993), Draine (2003), and Draine & Hensley (2021) for various dust compounds are shown as a function of energy. For both k(E) and n(E) the normalisation and decline with energy is close to the values expected for MgFeSiO4 or similar Fe-bearing silicates. Some correlations are apparent in the data (see Fig. 8). Since k sets the absorption within the grain, this makes its effect different from the effect of the real component, n, so that we can constrain them independently; in the posterior probability landscape, k(E) and n(E) are only mildly correlated.
k(E) and n(E) might be tied together by employing the Kramers-Kronig relations, which allows the full complex function to be reconstructed given either the imaginary or real component. In practice, this requires an integral over all energies (i.e. assuming the properties of n(E)/k(E) beyond the X-ray regime). However, our inferred (n(E), k(E)) from the data are reasonably consistent with the (n(E), k(E)) of various physical compounds, where the latter did include the Kramers-Kronig relation constraint. Our best fits result in optical constants that appear to be in near consistency with the Kramers-Kronig relations, without imposing it as a requirement.
3.4 Dust composition from constraints on the refractive index
In light of the strong preference in the data for the refractive index of the iron-rich silicates compared to other compositions, we explored the constraints that can be set compared to a mix of different composition grains, which may be more realistic based on depletion data (e.g. Henning 2010). Fig. 9 shows the resulting distribution of dust composition permitted from fitting within the limited parameter space of refractive index between Mg2SiO4 and Fe2SiO4. The resulting distribution favours the inclusion of iron in the dust grains that cause the scattering. MgSiO3 might also be the silicate component in the dust mixture and is perhaps preferred given evidence that the depletion of Mg:Si is near unity and their depletion rates are similar (Jenkins 2009; De Cia et al. 2016, 2018). Thus, to compare to the MgFeSiO4, we tried 1) a mix of iron-poor silicates with equal Si and Mg (enstatite-composition grains, MgSiO3) and pure Fe grains, and 2) a mix of amorphous carbon, and MgSiO3 and pure Fe grains. We also allowed the relative abundances of these components to be a free parameter to determine how well they could be constrained.
Overall, we were unable to distinguish between MgFeSiO4 and a mix of MgSiO3 and pure Fe grains, with or without C (in the form of graphitic carbon). Their fits had a similar quality (Table 1). Beyond this, however, we require an Fe component. We cannot determine whether the Fe is chemically part of the silicates. The Fe should be at a mass quantity comparable to the silicate or carbon components, but the fractional masses of MgSiO3 and carbon are anti-correlated and largely degenerate. The relative abundances of model 1 above for MgSiO3 and Fe are shown in Fig. 10. The ternary plots and the one-dimensional posterior probabilities for the three-component fit (2, above) are shown in Fig. 11.
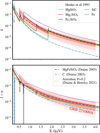 |
Fig. 7 Imaginary (k(E), top) and real (n(E), bottom) part of the refractive index from fitting photons with energies 0.5 keV < E < 4 keV. The red line indicates the median expected value from the fading of X-ray rings for GRB 221009A. The shading indicates the 1, 2, and 3σ uncertainty regions. The optical constants calculated for different compositions are plotted for comparison (Henke et al. 1993; Draine 2003) with astrodust (Draine & Hensley 2021, with porosity P = 0.2). Individually, Fe, SiC, or C do not match well, while mixtures of Mg- and Fe-silicate grains provide the closest match. |
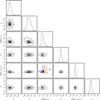 |
Fig. 8 Corner plot showing the posterior probability distributions of the best fit MRN grain size model with a power-law parametrisation of the refractive index with 1, 2, and 3σ contours. The key parameters of the MRN maximum grain size a+ and power-law slope q are shown, as are the refractive index’s real and imaginary power-law indices, nα, kα, and values at 1 keV, 1 − n1 keV, k1 keV. The dots indicate the expected refractive indices for different compositions of carbon grains (blue), metallic Fe grains (purple), Fe2SiO4 (dark blue), MgFeSiO4 (red), and MgSiO3 (orange). The equilibrium distribution found by the walkers displays a convex minima. While not imposing the Kramers-Kronig relations on the refractive indices, the best-fit n and k are close to standard physical compositions expected for ISM dust. The best-fit parameters are provided in Tables 2 and 3. |
4 Discussion
4.1 Bias in the maximum grain sizes inferred using the Rayleigh-Gans approximation
The study of X-ray scattering haloes has commonly employed the RG approximation to derive constraints on grain-size distributions (e.g. Smith et al. 2002; Corrales & Paerels 2015; Beardmore et al. 2016; Zhao & Shen 2024) or dust-column densities (e.g. Pintore et al. 2017). Exploring the larger parameter landscape of the ADT calculation (which subsumes the RG regime) allowed us to run a quantified test to determine to which extent these constraints are biased by the RG assumptions (see also the discussion in Corrales & Paerels 2015).
For instance, Beardmore et al. (2016) assessed the maximum grain size ![Mathematical equation: $\[a_{+}=0.147_{-0.004}^{+0.024}\]$](/articles/aa/full_html/2025/09/aa54741-25/aa54741-25-eq15.png) μm (90% confidence limits) in the sight line towards V404 Cygni, while towards Cygnus X-3 Corrales & Paerels (2015) argued a+ ≈ 0.15–0.2 μm. Towards GRB 221009A, a RG calculation would suggest a+ = 0.21 ± 0.01 μm from this analysis. When deviations from RG are allowed (i.e. freedom in k and n), however, a+ = 0.24 ± 0.01 μm. Thus, RG assumptions biased the grain size downwards, thereby disfavouring the actual best-fit value and highlighting that the systematic uncertainties associated with the RG assumption are larger than the statistical uncertainties of the RG fit. Physically, it is reasonable that the inclusion of absorption (in particular, weakening the scattering for large grains) would weaken the limit on the large-grain population.
μm (90% confidence limits) in the sight line towards V404 Cygni, while towards Cygnus X-3 Corrales & Paerels (2015) argued a+ ≈ 0.15–0.2 μm. Towards GRB 221009A, a RG calculation would suggest a+ = 0.21 ± 0.01 μm from this analysis. When deviations from RG are allowed (i.e. freedom in k and n), however, a+ = 0.24 ± 0.01 μm. Thus, RG assumptions biased the grain size downwards, thereby disfavouring the actual best-fit value and highlighting that the systematic uncertainties associated with the RG assumption are larger than the statistical uncertainties of the RG fit. Physically, it is reasonable that the inclusion of absorption (in particular, weakening the scattering for large grains) would weaken the limit on the large-grain population.
Lastly, it is worth noting that all these analyses strongly disagree with the RG fading results of Zhao & Shen (2024), who permitted 0.5 μm grains from the fading ring of GRB 221009A. The main difference between these analyses arise because Zhao & Shen (2024) integrated over energy, thereby losing the dimension that constrains the grain-size distribution. Specifically, the lower-energy photons (E<1 keV) of the rings do not fade as much and are thus inconsistent with a large-grain population.
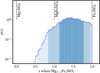 |
Fig. 9 Posterior probability distribution of the composition of interstellar dust from GRB 221009A from fitting a limited parameter space with a refractive index ranging from Mg2SiO4 to Fe2SiO4. The 1, 2, and 3σ intervals are indicated with increasingly lighter shades. While MgFeSiO4 is consistent with these constraints, a composition dominated by iron (i.e. Fe2SiO4) is disfavoured, while an iron-free dust composition is excluded. This seems to be due to the imaginary component of the refractive index, k, being too low to be consistent with the data without the presence of a good fraction of some heavier elements, i.e. iron, in the dust (Fig. 7). |
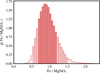 |
Fig. 10 Posterior probability distribution on the relative composition of Fe and MgSiO3. The 1, 2, and 3σ intervals are indicated with increasingly lighter shades. |
4.2 Implications for the chemical composition of dust grains
The fraction of Fe that is locked up in dust has been studied in detail (e.g. Poteet et al. 2015; Dwek 2016; Zeegers et al. 2017; Zhukovska et al. 2018; Mattsson et al. 2019; Westphal et al. 2019). Generally, the Fe depletion out of the gas phase is known to be very high even in the relatively diffuse ISM; in the Galaxy, it is typically depleted at >90% even in relatively low-depletion sight lines (Savage & Sembach 1996; Jenkins 2009; Draine 2011; De Cia et al. 2016, 2018; Konstantopoulou et al. 2022, 2024). Exactly where this iron resides in the dust is still an open question. The most likely locations are chemically bound in silicates, free-floating metallic (or possibly iron oxide) grains, or metallic grains embedded in silicates. Specific environments such as dust shells surrounding evolved stars display silicates that are generally Mg rich and Fe poor (Molster et al. 2002) with an abundance fraction A(Fe) ≲ 1/3 A(Mg) (Tielens et al. 1998). In general, most silicates in the ISM are thought to be Mg rich and iron poor on the basis of depletion rate studies (Mattsson et al. 2019) and infrared studies of the position of the 9.7 μm silicate absorption feature (Min et al. 2007), although the decisive statement has still to be written. Fe L-shell extinction data suggest that the sight lines to four X-ray binaries are dominated by Mg-rich pyroxene Mg0.75 Fe0.25SiO3 (or olivine, MgFeSiO4, for one sight-line; Psaradaki et al. 2023). Earlier work on Mg and Si K-shell features suggested olivine as the dominant silicate (Zeegers et al. 2019; Rogantini et al. 2019, 2020). Corrales et al. (2024) found that iron-bearing materials account for 20–30% of the total mass of interstellar dust from Fe L-shell absorption, although notable uncertainties in X-ray atomic databases are present around the Fe L-edge (Psaradaki et al. 2024). For reference, we note that the Fe, Si, and Mg abundances by number inferred from the solar photosphere and Solar System meteoritics are similar (e.g. A(Fe)/A(Mg) = 0.83 ± 0.03 and A(Fe)/A(Si) = 0.87 ± 0.03, Asplund et al. 2009) or nearly twice as much in iron by mass, that is, 1.85 ± 0.06 and 1.73 ± 0.06, respectively, which sums to 0.9 in the mass ratio Fe/(Mg + Si). When we account for the oxygen that is thought to be bound in silicates, assuming the Fe is chemically separate and metallic as a minimum case, this indicates a mass ratio of Fe/MgSiO3 of about 0.48. This should be considered a lower bound, however, because gas depletion measurements show that Fe is typically more often in the solid form than Si or Mg, which both deplete at similar rates (e.g. De Cia et al. 2016, 2018; Konstantopoulou et al. 2022, 2024). In the diffuse ISM, the expectation therefore is that the mass ratio of Fe/silicates is roughly 0.5–1. Similarly, the C/silicates mass ratio is near unity when depletion effects are not accounted for, but we caution that the depletion of C is highly uncertain. When we assume a similar depletion for C and Mg or Si, this suggests that we would a priori expect the Fe mass fraction in the dust to be approximately 30%, depending on the depletion level of the ISM.
The total iron mass fraction of the composition for the three species posterior inferred from the scattering rings is substantial (see Fig. 11). The median mass fraction, x(Fe) = 35 ± 7%, is broadly consistent with the discussion above, in particular, at its lower end. Overall, our compositional constraints should be considered approximate because we did not explore broader composition ranges or grain geometries. An improved modelling may be addressed in future work, and we return to this in Sect. 4.4 below.
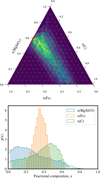 |
Fig. 11 Upper panel: ternary plot with posterior distribution of the mass fractional composition with three representative components: MgSiO3, Fe, and C (graphitic carbon). This three-dimensional space is plotted in a 2D ternary landscape because the sum of the contributions equals one. The 1 and 2σ contours are indicated with red and dark red lines, respectively. Lower panel: 1D posterior distribution of the relative masses of MgSiO3, Fe, and graphitic carbon. The Fe content is bounded from below and above, x(Fe) = 0.35 ± 0.07, while an unconstrained ratio mix of C and MgSiO3 makes up the rest. |
4.3 Variation in the composition by grain size
It remains an open question whether the chemical composition of grains varies with grain size. Modelling typically assumes that the composition is independent of a, although there are exceptions (e.g. Jones et al. 2017). The largest grains (~0.1 μm) are the dominant contributors to the grain mass1 and also to the scattering signal (as dσ/dΩ ∝ a6 for RG), and therefore, we are most sensitive to the composition of these grains. Our analysis showed a consistency between the grain composition inferred from scattering and the composition expected from the overall solar elemental composition (i.e. comparable magnesium, silicon, and iron by number, Lodders 2003). Thus, the composition of these large grains is similar to the composition expected for the overall elemental composition in most of the Milky Way ISM.
The spectral resolution of EPIC is quite low, so that individual absorption edges and lines cannot be resolved, as was done in high spectral resolution studies of direct X-rays that are absorbed or scattered by the metals in the ISM (e.g. Lee & Ravel 2005). While the energy and atomic number (Z) dependence of the imaginary component of the refractive index is roughly k(Z, E) ∝ Z4E−3 (Henke et al. 1993), this energy dependence is true above the relevant edge energies. Thus, the slope of the resulting k(E)MgFeSiO4 is fainter than that of any individual element, and we expect a power-law slope α > −3. Of the X-ray edges, the prominent oxygen K-edge at 0.532 keV can abruptly change k by a factor of several. Unfortunately, the signal in the rings of GRB 230307A drops quickly below 1 keV (Tiengo et al. 2023), which leaves little statistical constraining power at these low energies. The method we introduced (and its success at higher energies), however, highlights the potential for future studies to constrain the refractive index at lower energies by measuring the scattered light directly at high spectral resolution or at a better signal-to-noise ratio, thereby measuring the prominence of the oxygen K-edge and potentially the abundance of oxygen as a function of grain size.
4.4 Limitations of our scattering framework
There are several limitations to our modelling. First, the spherical assumption for grains may not hold, as explored by Draine & Allaf-Akbari (2006), where oblate spheroids scattered more on the short axis of the grain. For aligned grains, as observed throughout the Milky Way (Andersson et al. 2015; Planck Collaboration XII 2020), this might produce angular dependences around the ring. Our grain sizes are the radii of spherical grains, so that a more detailed modelling would include the possibility of aspherical grains and use the polarisation maps to estimate grain alignment. Second, substructures within grains (e.g. spatial inhomogeneities or porous structures (Hoffman & Draine 2016)) may narrow the forward-scattering peak. Third, we employed a single-scattering framework that did not account for the potential multiple scattering if the scattering optical depth becomes large (Draine & Tan 2003). Fourth, we did not account for any potential weakening or strengthening of the rings through changes in the relative dust column density along sight liness towards larger angles. This may be justified given the random nature of the initial GRB position and the observed minor (azimuthally averaged) radial variation in total hydrogen column density in the sky area around GRB 221009A (Planck Collaboration XI 2014; Tiengo et al. 2023). Regardless, all of these effects may to a greater or lesser extent be partially degenerate with the refractive index in impacting the forward-scattering, which perhaps makes it all the more remarkable that with an MRN grain-size distribution of spherical grains, we found a reasonable refractive index. Finally, we did not allow for the different dust sheets to have different dust properties, and we assumed a single-grain population with a common composition as a function of size.
While the derived refractive indices agree largely with the Kramers-Kronig relations, the central values of the refractive index parameters do indicate the absorption, k, is the one that favours a presence of Fe, whereas the real part, n, is more weakly constraining (see Figs. 7 and 8). Notably, a difference between the n and k properties might indicate that the elements that mainly cause scattering and absorption have different grain-size distributions. That is, the freedom of two compositionally distinct grain-size distributions may allow a simultaneous modelling of k and n, which thus might provide evidence of a varying chemical composition with grain size.
5 Conclusions
We have analysed the fading X-ray rings that were observed 2.31–5.07 days after the brightest GRB ever observed, GRB 221009A. Our analysis found four results that we list below.
The lack of a strong fading in the rings at lower photon energies (E ≲ 1keV) excludes a significant population of large grains, that is, grain sizes a ~ 0.4 μm. This rules out a large-grain population along this line of sight, such as those in Hensley & Draine (2023), which are otherwise favoured from analyses designed to reproduce the mean wavelength dependence and polarisation of Galactic extinction.
Implementing anomalous diffraction theory provided statistically superior fits to the often-used Rayleigh-Gans approximation. This underlines that the latter method is biased by its assumptions.
Using anomalous diffraction theory, we measured the complex refractive index, m(E) = n(E) + ik(E), of the grains. The best-fit n and k values agree in general with the fiducial expectations from depletion studies, which are approximately consistent with iron and silicates. k(E) in particular required a substantial contribution of iron to the dust grain refractive index. For a mixture of Fe, MgSiO3 and graphitic carbon, we found an iron mass fraction of
![Mathematical equation: $\[0.35_{-0.15}^{+0.12}\]$](/articles/aa/full_html/2025/09/aa54741-25/aa54741-25-eq16.png) (2σ intervals). Although substantial, this is broadly consistent with data on the ISM abundance and depletion.
(2σ intervals). Although substantial, this is broadly consistent with data on the ISM abundance and depletion.From our fits, we also recovered the soft X-ray spectrum of the prompt emission that produced the rings. This is consistent with an extrapolation of the low-energy slope of the hard X-ray and γ-ray emission around the peak time of the prompt emission, even though this is not imposed by the fit.
The analysis presented here did not use all possible available constraints and allowed us freedom in most fit parameters. This implies that improved constraints might be attained using more information on the input spectrum by imposing the Kramers-Kronig relations on the refractive indices and by using the available data on the dust distribution and polarisation along the line of sight. The simplicity of our scattering analysis (e.g. we did not explicitly study porosity, grain geometries, or multiple grain populations) motivates further exploration of this and similar datasets, however. These results would further highlight the remarkable insight into dust properties contained within the scattering rings of the brightest extragalactic explosion ever observed and from bright transient sources more generally.
Acknowledgements
The authors would like to thank Bruce Draine for insightful ideas and several important suggestions, including the use of ADT and some questions to pursue. We also thank Anja C. Andersen and the anonymous referee for providing useful feedback on the content. The Cosmic Dawn Center (DAWN) is funded by the Danish National Research Foundation under grant No. 140. A.S. and D.W. are funded in part by the European Union (ERC, HEAVYMETAL, 101071865). Views and opinions expressed are, however, those of the authors only and do not necessarily reflect those of the European Union or the European Research Council. Neither the European Union nor the granting authority can be held responsible for them.
References
- Andersson, B. G., Lazarian, A., & Vaillancourt, J. E. 2015, ARA&A, 53, 501 [Google Scholar]
- Asplund, M., Grevesse, N., Sauval, A. J., & Scott, P. 2009, ARA&A, 47, 481 [NASA ADS] [CrossRef] [Google Scholar]
- Beardmore, A. P., Willingale, R., Kuulkers, E., et al. 2016, MNRAS, 462, 1847 [Google Scholar]
- Corrales, L. R., & Paerels, F. 2015, MNRAS, 453, 1121 [NASA ADS] [CrossRef] [Google Scholar]
- Corrales, L., Gotthelf, E. V., Gatuzz, E., et al. 2024, ApJ, 965, 172 [Google Scholar]
- Costantini, E., & Corrales, L. 2022, in Handbook of X-ray and Gamma-ray Astrophysics, eds. C. Bambi, & A. Sangangelo (Berlin: Springer), 40 [Google Scholar]
- De Cia, A., Ledoux, C., Mattsson, L., et al. 2016, A&A, 596, A97 [NASA ADS] [CrossRef] [EDP Sciences] [Google Scholar]
- De Cia, A., Ledoux, C., Petitjean, P., & Savaglio, S. 2018, A&A, 611, A76 [NASA ADS] [CrossRef] [EDP Sciences] [Google Scholar]
- de Vries, C. P., & Costantini, E. 2009, A&A, 497, 393 [NASA ADS] [CrossRef] [EDP Sciences] [Google Scholar]
- Draine, B. T. 2003, ApJ, 598, 1026 [Google Scholar]
- Draine, B. T. 2011, Physics of the Interstellar and Intergalactic Medium (Princeton: Princeton University Press) [Google Scholar]
- Draine, B. T., & Allaf-Akbari, K. 2006, ApJ, 652, 1318 [Google Scholar]
- Draine, B. T., & Hensley, B. S. 2021, ApJ, 909, 94 [NASA ADS] [CrossRef] [Google Scholar]
- Draine, B. T., & Tan, J. C. 2003, ApJ, 594, 347 [NASA ADS] [CrossRef] [Google Scholar]
- Dwek, E. 2016, ApJ, 825, 136 [NASA ADS] [CrossRef] [Google Scholar]
- Foreman-Mackey, D., Hogg, D. W., Lang, D., & Goodman, J. 2013, PASP, 125, 306 [Google Scholar]
- Heinz, S., Burton, M., Braiding, C., et al. 2015, ApJ, 806, 265 [Google Scholar]
- Henke, B. L., Gullikson, E. M., & Davis, J. C. 1993, Atomic Data Nucl. Data Tables, 54, 181 [Google Scholar]
- Henning, T. 2010, ARA&A, 48, 21 [Google Scholar]
- Hensley, B. S., & Draine, B. T. 2023, ApJ, 948, 55 [Google Scholar]
- Hoffman, J., & Draine, B. T. 2016, ApJ, 817, 139 [NASA ADS] [CrossRef] [Google Scholar]
- Jenkins, E. B. 2009, ApJ, 700, 1299 [Google Scholar]
- Jones, A. P., Köhler, M., Ysard, N., Bocchio, M., & Verstraete, L. 2017, A&A, 602, A46 [NASA ADS] [CrossRef] [EDP Sciences] [Google Scholar]
- Konstantopoulou, C., De Cia, A., Krogager, J.-K., et al. 2022, A&A, 666, A12 [NASA ADS] [CrossRef] [EDP Sciences] [Google Scholar]
- Konstantopoulou, C., De Cia, A., Ledoux, C., et al. 2024, A&A, 681, A64 [NASA ADS] [CrossRef] [EDP Sciences] [Google Scholar]
- Lee, J. C., & Ravel, B. 2005, ApJ, 622, 970 [NASA ADS] [CrossRef] [Google Scholar]
- Lesage, S., Veres, P., Briggs, M. S., et al. 2023, ApJ, 952, L42 [NASA ADS] [CrossRef] [Google Scholar]
- Lodders, K. 2003, ApJ, 591, 1220 [Google Scholar]
- Malesani, D. B., Levan, A. J., Izzo, L., et al. 2025, A&A, in press, https://doi.org/10.1051/0004-6361/202346146 [NASA ADS] [CrossRef] [EDP Sciences] [Google Scholar]
- Mathis, J. S., Rumpl, W., & Nordsieck, K. H. 1977, ApJ, 217, 425 [Google Scholar]
- Mattsson, L., De Cia, A., Andersen, A. C., & Petitjean, P. 2019, A&A, 624, A103 [NASA ADS] [CrossRef] [EDP Sciences] [Google Scholar]
- Mauche, C. W., & Gorenstein, P. 1986, ApJ, 302, 371 [Google Scholar]
- Min, M., Waters, L. B. F. M., de Koter, A., et al. 2007, A&A, 462, 667 [NASA ADS] [CrossRef] [EDP Sciences] [Google Scholar]
- Molster, F. J., Waters, L. B. F. M., & Tielens, A. G. G. M. 2002, A&A, 382, 222 [NASA ADS] [CrossRef] [EDP Sciences] [Google Scholar]
- Newville, M., Stensitzki, T., Allen, D. B., et al. 2016, Astrophysics Source Code Library [record ascl:1606.014] [Google Scholar]
- Overbeck, J. W. 1965, ApJ, 141, 864 [Google Scholar]
- Pintore, F., Tiengo, A., Mereghetti, S., et al. 2017, MNRAS, 472, 1465 [NASA ADS] [CrossRef] [Google Scholar]
- Planck Collaboration XI. 2014, A&A, 571, A11 [NASA ADS] [CrossRef] [EDP Sciences] [Google Scholar]
- Planck Collaboration XII. 2020, A&A, 641, A12 [NASA ADS] [CrossRef] [EDP Sciences] [Google Scholar]
- Poteet, C. A., Whittet, D. C. B., & Draine, B. T. 2015, ApJ, 801, 110 [NASA ADS] [CrossRef] [Google Scholar]
- Predehl, P., & Schmitt, J. H. M. M. 1995, A&A, 293, 889 [NASA ADS] [Google Scholar]
- Psaradaki, I., Costantini, E., Rogantini, D., et al. 2023, A&A, 670, A30 [NASA ADS] [CrossRef] [EDP Sciences] [Google Scholar]
- Psaradaki, I., Corrales, L., Werk, J., et al. 2024, AJ, 167, 217 [NASA ADS] [CrossRef] [Google Scholar]
- Read, A. M., Rosen, S. R., Saxton, R. D., & Ramirez, J. 2011, A&A, 534, A34 [NASA ADS] [CrossRef] [EDP Sciences] [Google Scholar]
- Rogantini, D., Costantini, E., Zeegers, S. T., et al. 2019, A&A, 630, A143 [NASA ADS] [CrossRef] [EDP Sciences] [Google Scholar]
- Rogantini, D., Costantini, E., Zeegers, S. T., et al. 2020, A&A, 641, A149 [NASA ADS] [CrossRef] [EDP Sciences] [Google Scholar]
- Rolf, D. P. 1983, Nature, 302, 46 [Google Scholar]
- Savage, B. D., & Sembach, K. R. 1996, ARA&A, 34, 279 [Google Scholar]
- Smith, R. K., & Dwek, E. 1998, ApJ, 503, 831 [NASA ADS] [CrossRef] [Google Scholar]
- Smith, R. K., Edgar, R. J., & Shafer, R. A. 2002, ApJ, 581, 562 [Google Scholar]
- Tielens, A. G. G. M., Waters, L. B. F. M., Molster, F. J., & Justtanont, K. 1998, Ap&SS, 255, 415 [Google Scholar]
- Tiengo, A., & Mereghetti, S. 2006, A&A, 449, 203 [NASA ADS] [CrossRef] [EDP Sciences] [Google Scholar]
- Tiengo, A., Vianello, G., Esposito, P., et al. 2010, ApJ, 710, 227 [Google Scholar]
- Tiengo, A., Pintore, F., Vaia, B., et al. 2023, ApJ, 946, L30 [NASA ADS] [CrossRef] [Google Scholar]
- Vaia, B., Bošnjak, Ž., Bracco, A., et al. 2025, A&A, 696, A9 [NASA ADS] [CrossRef] [EDP Sciences] [Google Scholar]
- van de Hulst, H. C. 1957, Light Scattering by Small Particles (New York: Dover Publications) [Google Scholar]
- Vasilopoulos, G., Karavola, D., Stathopoulos, S. I., & Petropoulou, M. 2023, MNRAS, 521, 1590 [NASA ADS] [Google Scholar]
- Vaughan, S., Willingale, R., O’Brien, P. T., et al. 2004, ApJ, 603, L5 [Google Scholar]
- Vaughan, S., Willingale, R., Romano, P., et al. 2006, ApJ, 639, 323 [Google Scholar]
- Watson, D., Vaughan, S. A., Willingale, R., et al. 2006, ApJ, 636, 967 [Google Scholar]
- Weingartner, J. C., & Draine, B. T. 2001, ApJ, 548, 296 [Google Scholar]
- Westphal, A. J., Butterworth, A. L., Tomsick, J. A., & Gainsforth, Z. 2019, ApJ, 872, 66 [NASA ADS] [CrossRef] [Google Scholar]
- Williams, M. A., Kennea, J. A., Dichiara, S., et al. 2023, ApJ, 946, L24 [NASA ADS] [CrossRef] [Google Scholar]
- Xu, Y., McCray, R., & Kelley, R. 1986, Nature, 319, 652 [Google Scholar]
- Zeegers, S. T., Costantini, E., de Vries, C. P., et al. 2017, A&A, 599, A117 [NASA ADS] [CrossRef] [EDP Sciences] [Google Scholar]
- Zeegers, S. T., Costantini, E., Rogantini, D., et al. 2019, A&A, 627, A16 [NASA ADS] [CrossRef] [EDP Sciences] [Google Scholar]
- Zhao, G., & Shen, R.-F. 2024, ApJ, 970, 124 [NASA ADS] [Google Scholar]
- Zhukovska, S., Henning, T., & Dobbs, C. 2018, ApJ, 857, 94 [Google Scholar]
For an MRN distribution with q < 4, this follows from M ∝ ∫ a3−qda.
All Tables
Model comparison using various dust grain-size distributions [(MRN Mathis et al. 1977), (HD Hensley & Draine 2023)] and various assumptions for refractive index models (e.g. ADT or RG).
Best-fit grain properties and relative incident flux in various bands with 1σ uncertainties.
All Figures
|
Fig. 1 Left and centre: exposure-corrected 0.5–4 keV images observed about six hours apart. Right: difference images highlighting the short-timescale evolution over six hours. the blue-red pattern shows rings undergoing outward motion and subtle fading. The top row shows data from the first epoch, around 2.3 days, from the EPIC MOS1 and MOS2 cameras, and the bottom row shows the second-epoch data from around 4.7 days from EPIC MOS1, MOS2, and pn. |
| In the text | |
|
Fig. 2 X-ray counts as a function of the two main derived dimensions of our data-set, dust distance (left) and scattering angle (right). The left panel shows the normalised histogram of counts in logarithmic bins of distance, i.e. angular distance from the GRB position transformed using D = 2ctθ−2 (see Eq. (1)). Epochs 1 and 2 are shown in blue and red, respectively, and distinct rings (i.e. dust sheets associated with increased scattering) are indicated with dashed grey lines. The right panel illustrates the angular dependence of the counts, where we report counts relative to 0.04° and marginalised over distances (i.e. by summing counts over various line-of-sight distances divided by the inferred dust density at that distance). This highlights the typical fading of rings with increasing angle, and it shows that for harder photon energies, the rings fade more rapidly with angle. |
| In the text | |
|
Fig. 3 X-ray halo model intensity (left column), observed intensity (middle column), and χ2-comparison (right column) as a function of angle (θ) and post-GRB time (td) in different energy bands. The rings expand with time and, particularly at higher energies, fade with increasing angle. An MRN grain-size distribution (with parameters summarised in Fig. 8) describe the fading of rings within and between epochs. The pixels associated with large deviations from the model (i.e. large χ2) are distributed with no particular correlation to the position of the dust rings. |
| In the text | |
|
Fig. 4 Radial dust density landscape fitted for the fiducial computation (black) and for a radial resolution twice higher (blue). The increased resolution allows for greater constraints on the radial distribution of dust, but is not important in measuring the energy or azimuthal fading of a ring at a given distance. |
| In the text | |
|
Fig. 5 Input spectrum of the GRB prior to scattering on Galactic dust sheets. The blue error bars indicate the inferred input X-ray signal for the best-fit model grain-properties. For comparison, the expected shape of a power-law decline of the prompt signal (dashed black line) with substantial MW and host galaxy absorption found in previous work (e.g. NH ~ 3 × 10²¹−2 × 1022 cm−2; Williams et al. 2023; Vaia et al. 2025) follow the predicted input spectrum suggested by the best-fit grain properties. |
| In the text | |
|
Fig. 6 Dust grain-size distribution, n(a), showing the posterior probability distribution of fits to the GRB 221009A X-ray rings, with a model based on the MRN (Mathis et al. 1977) distribution with an additional large-grain size lognormal component. The proposed grain-size distribution of Hensley & Draine (2023) is shown for comparison, and the best-fit parameters of this parametrisation is shown as well. The dotted line indicates the 95th percentile (2σ) upper envelope on the grain-size distribution. Strong limits can be placed on the population of a ~ 0.4 μm grains, which must be several orders of magnitude less abundant than grains with a ~ 0.2 μm. Because of the lack of grains at this size, the Hensley & Draine (2023) grain-size distribution is disfavoured for this sight line. Larger grains (≳1 μm) are not strongly constrained as these predominantly scatter at smaller angles than we measure with these data. |
| In the text | |
|
Fig. 7 Imaginary (k(E), top) and real (n(E), bottom) part of the refractive index from fitting photons with energies 0.5 keV < E < 4 keV. The red line indicates the median expected value from the fading of X-ray rings for GRB 221009A. The shading indicates the 1, 2, and 3σ uncertainty regions. The optical constants calculated for different compositions are plotted for comparison (Henke et al. 1993; Draine 2003) with astrodust (Draine & Hensley 2021, with porosity P = 0.2). Individually, Fe, SiC, or C do not match well, while mixtures of Mg- and Fe-silicate grains provide the closest match. |
| In the text | |
|
Fig. 8 Corner plot showing the posterior probability distributions of the best fit MRN grain size model with a power-law parametrisation of the refractive index with 1, 2, and 3σ contours. The key parameters of the MRN maximum grain size a+ and power-law slope q are shown, as are the refractive index’s real and imaginary power-law indices, nα, kα, and values at 1 keV, 1 − n1 keV, k1 keV. The dots indicate the expected refractive indices for different compositions of carbon grains (blue), metallic Fe grains (purple), Fe2SiO4 (dark blue), MgFeSiO4 (red), and MgSiO3 (orange). The equilibrium distribution found by the walkers displays a convex minima. While not imposing the Kramers-Kronig relations on the refractive indices, the best-fit n and k are close to standard physical compositions expected for ISM dust. The best-fit parameters are provided in Tables 2 and 3. |
| In the text | |
|
Fig. 9 Posterior probability distribution of the composition of interstellar dust from GRB 221009A from fitting a limited parameter space with a refractive index ranging from Mg2SiO4 to Fe2SiO4. The 1, 2, and 3σ intervals are indicated with increasingly lighter shades. While MgFeSiO4 is consistent with these constraints, a composition dominated by iron (i.e. Fe2SiO4) is disfavoured, while an iron-free dust composition is excluded. This seems to be due to the imaginary component of the refractive index, k, being too low to be consistent with the data without the presence of a good fraction of some heavier elements, i.e. iron, in the dust (Fig. 7). |
| In the text | |
|
Fig. 10 Posterior probability distribution on the relative composition of Fe and MgSiO3. The 1, 2, and 3σ intervals are indicated with increasingly lighter shades. |
| In the text | |
|
Fig. 11 Upper panel: ternary plot with posterior distribution of the mass fractional composition with three representative components: MgSiO3, Fe, and C (graphitic carbon). This three-dimensional space is plotted in a 2D ternary landscape because the sum of the contributions equals one. The 1 and 2σ contours are indicated with red and dark red lines, respectively. Lower panel: 1D posterior distribution of the relative masses of MgSiO3, Fe, and graphitic carbon. The Fe content is bounded from below and above, x(Fe) = 0.35 ± 0.07, while an unconstrained ratio mix of C and MgSiO3 makes up the rest. |
| In the text | |
Current usage metrics show cumulative count of Article Views (full-text article views including HTML views, PDF and ePub downloads, according to the available data) and Abstracts Views on Vision4Press platform.
Data correspond to usage on the plateform after 2015. The current usage metrics is available 48-96 hours after online publication and is updated daily on week days.
Initial download of the metrics may take a while.