Fig. 11
Download original image
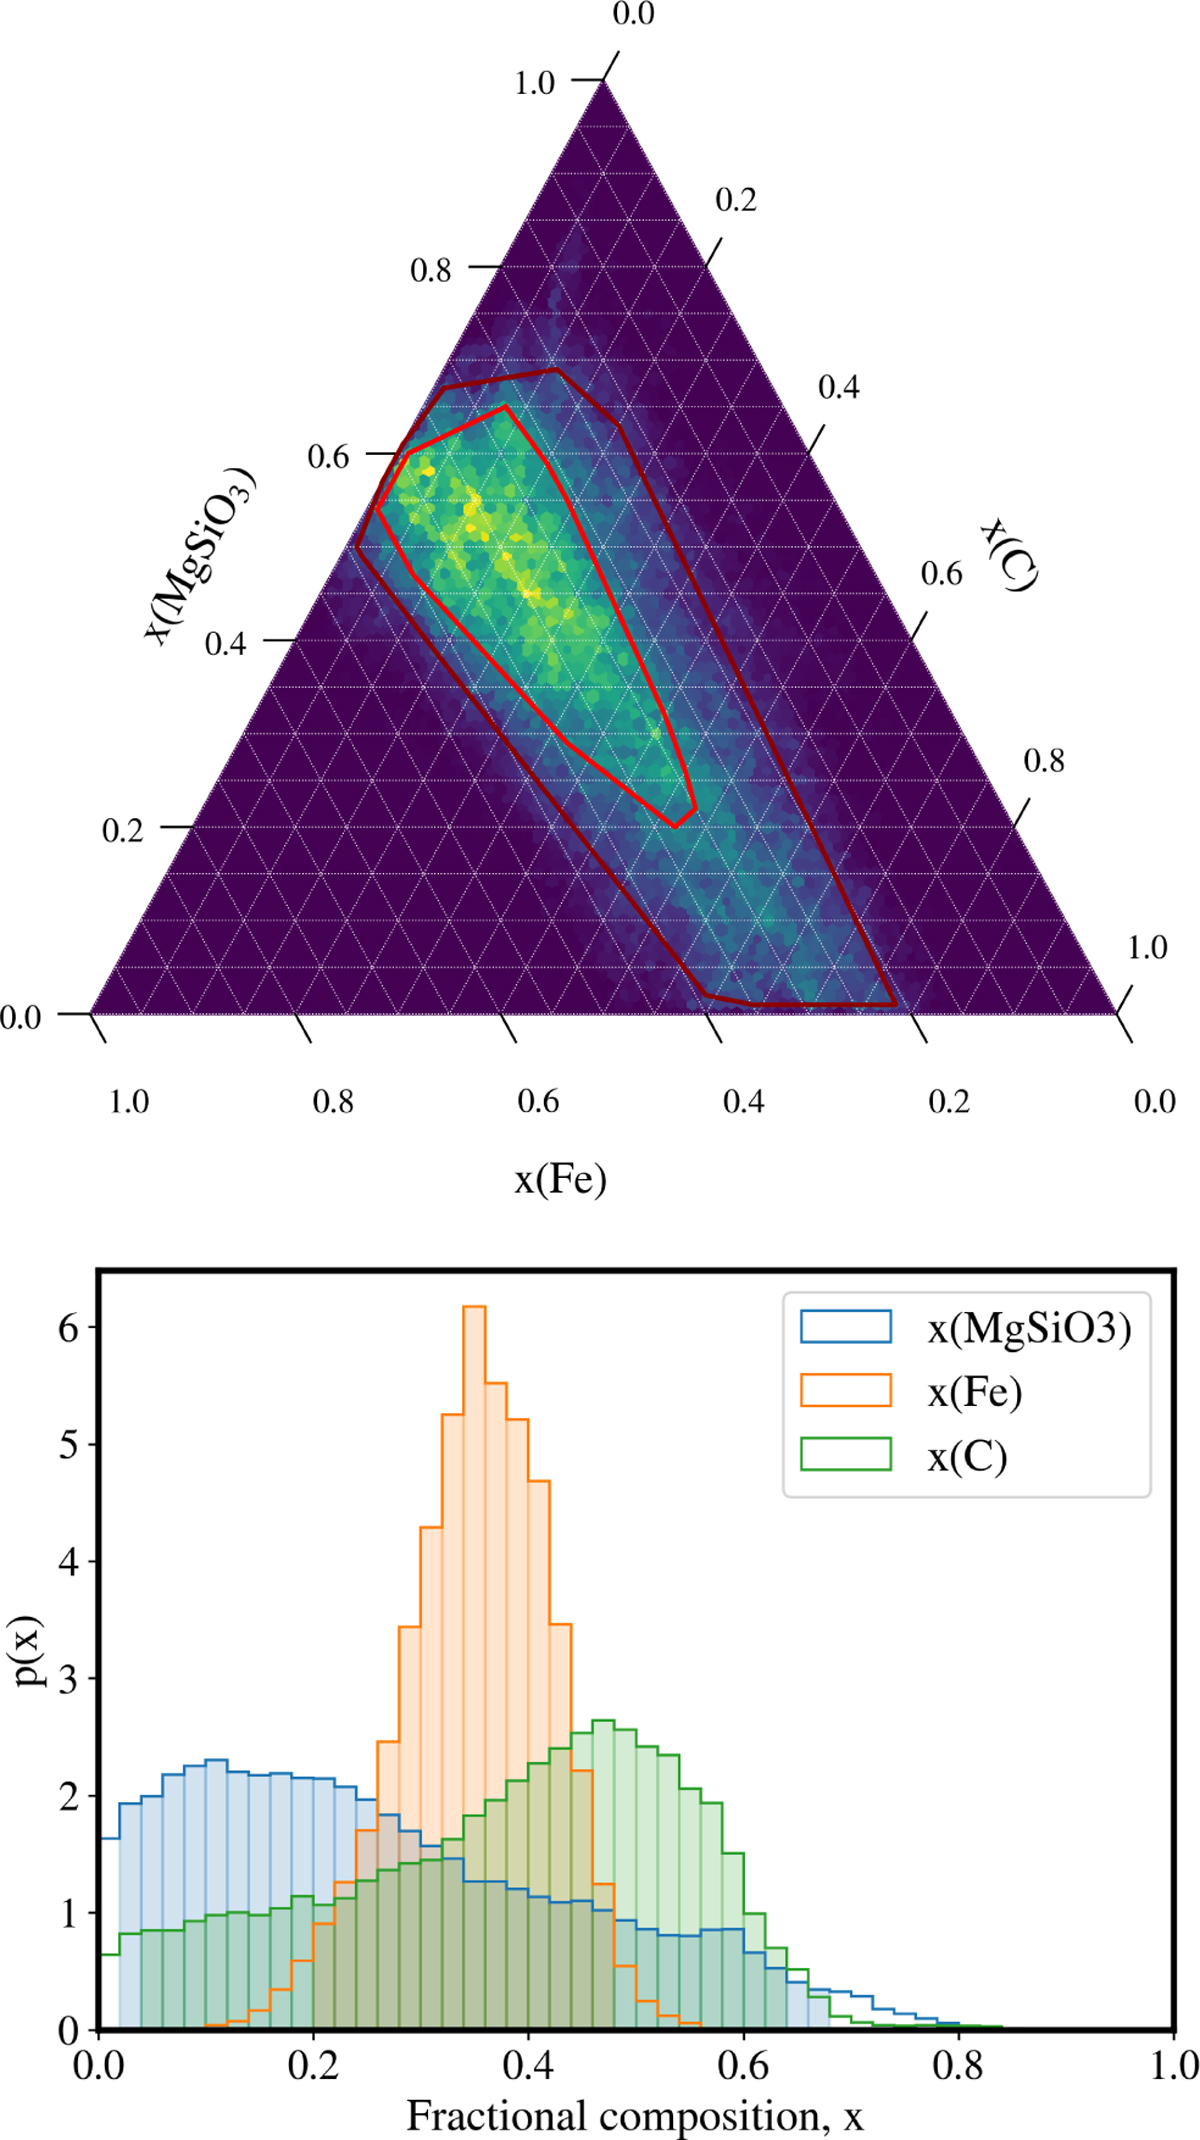
Upper panel: ternary plot with posterior distribution of the mass fractional composition with three representative components: MgSiO3, Fe, and C (graphitic carbon). This three-dimensional space is plotted in a 2D ternary landscape because the sum of the contributions equals one. The 1 and 2σ contours are indicated with red and dark red lines, respectively. Lower panel: 1D posterior distribution of the relative masses of MgSiO3, Fe, and graphitic carbon. The Fe content is bounded from below and above, x(Fe) = 0.35 ± 0.07, while an unconstrained ratio mix of C and MgSiO3 makes up the rest.
Current usage metrics show cumulative count of Article Views (full-text article views including HTML views, PDF and ePub downloads, according to the available data) and Abstracts Views on Vision4Press platform.
Data correspond to usage on the plateform after 2015. The current usage metrics is available 48-96 hours after online publication and is updated daily on week days.
Initial download of the metrics may take a while.