Fig. 2
Download original image
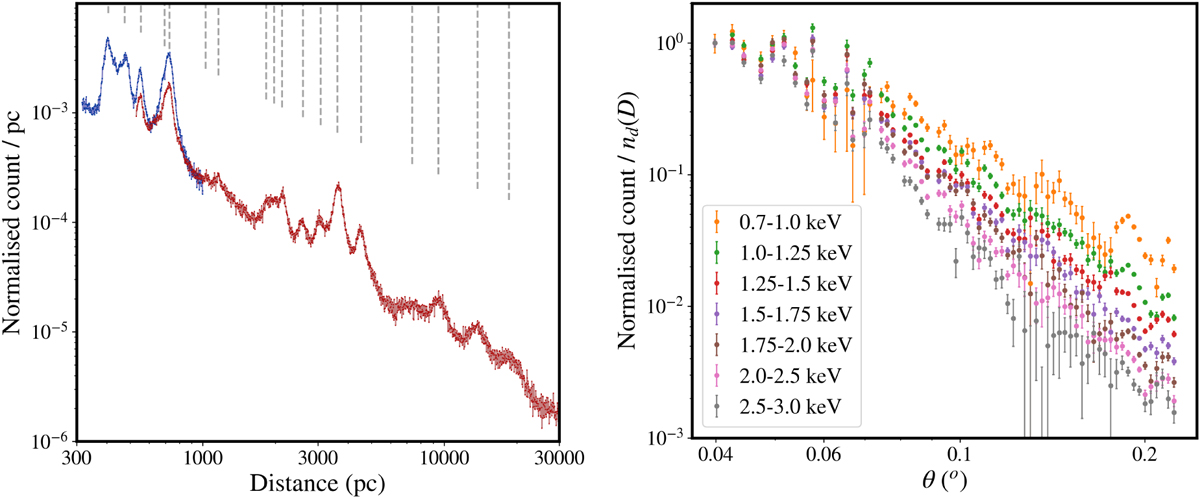
X-ray counts as a function of the two main derived dimensions of our data-set, dust distance (left) and scattering angle (right). The left panel shows the normalised histogram of counts in logarithmic bins of distance, i.e. angular distance from the GRB position transformed using D = 2ctθ−2 (see Eq. (1)). Epochs 1 and 2 are shown in blue and red, respectively, and distinct rings (i.e. dust sheets associated with increased scattering) are indicated with dashed grey lines. The right panel illustrates the angular dependence of the counts, where we report counts relative to 0.04° and marginalised over distances (i.e. by summing counts over various line-of-sight distances divided by the inferred dust density at that distance). This highlights the typical fading of rings with increasing angle, and it shows that for harder photon energies, the rings fade more rapidly with angle.
Current usage metrics show cumulative count of Article Views (full-text article views including HTML views, PDF and ePub downloads, according to the available data) and Abstracts Views on Vision4Press platform.
Data correspond to usage on the plateform after 2015. The current usage metrics is available 48-96 hours after online publication and is updated daily on week days.
Initial download of the metrics may take a while.