Fig. 7
Download original image
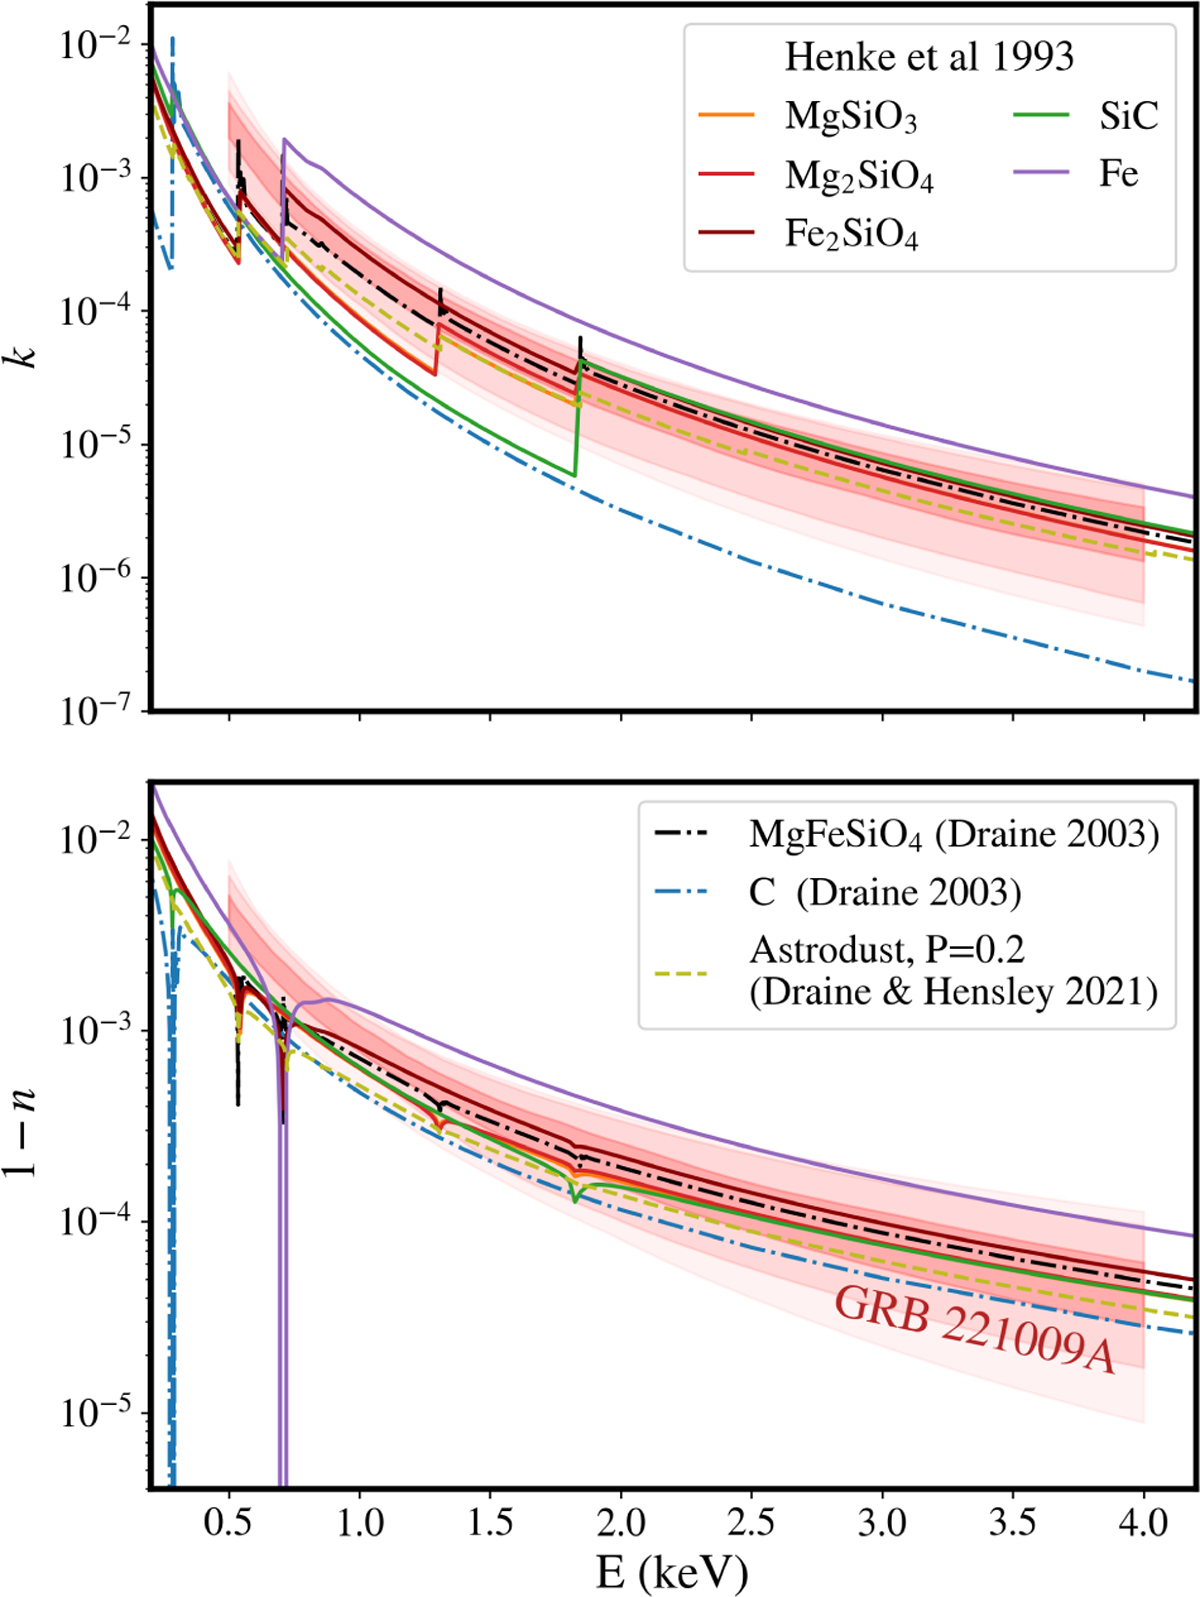
Imaginary (k(E), top) and real (n(E), bottom) part of the refractive index from fitting photons with energies 0.5 keV < E < 4 keV. The red line indicates the median expected value from the fading of X-ray rings for GRB 221009A. The shading indicates the 1, 2, and 3σ uncertainty regions. The optical constants calculated for different compositions are plotted for comparison (Henke et al. 1993; Draine 2003) with astrodust (Draine & Hensley 2021, with porosity P = 0.2). Individually, Fe, SiC, or C do not match well, while mixtures of Mg- and Fe-silicate grains provide the closest match.
Current usage metrics show cumulative count of Article Views (full-text article views including HTML views, PDF and ePub downloads, according to the available data) and Abstracts Views on Vision4Press platform.
Data correspond to usage on the plateform after 2015. The current usage metrics is available 48-96 hours after online publication and is updated daily on week days.
Initial download of the metrics may take a while.