Fig. 1
Download original image
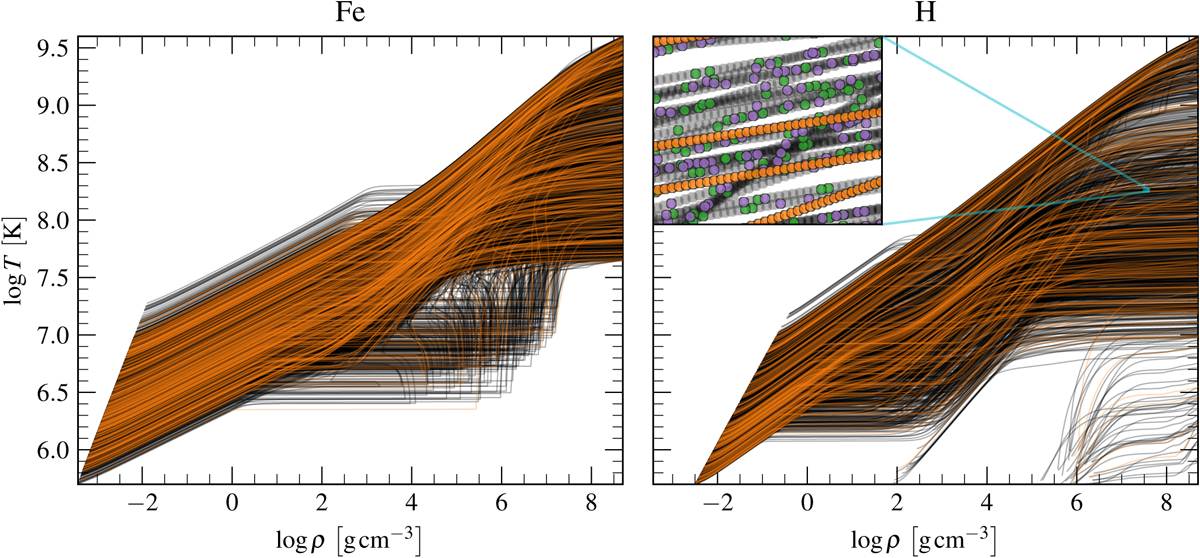
Profile curves from the NS envelope simulations for the Fe (left panel) and H envelope (right panel). Orange lines indicate the holdout curves used as an alternative test set. In the inset we show a zoom-in illustrating the random assignment of data points to the training (black), validation (green), and test (purple) sets from 90% of the profiles as well as the holdout points (orange) comprised of whole curves (the remaining 10%; see Sect. 2.4 for details).
Current usage metrics show cumulative count of Article Views (full-text article views including HTML views, PDF and ePub downloads, according to the available data) and Abstracts Views on Vision4Press platform.
Data correspond to usage on the plateform after 2015. The current usage metrics is available 48-96 hours after online publication and is updated daily on week days.
Initial download of the metrics may take a while.