Fig. 5
Download original image
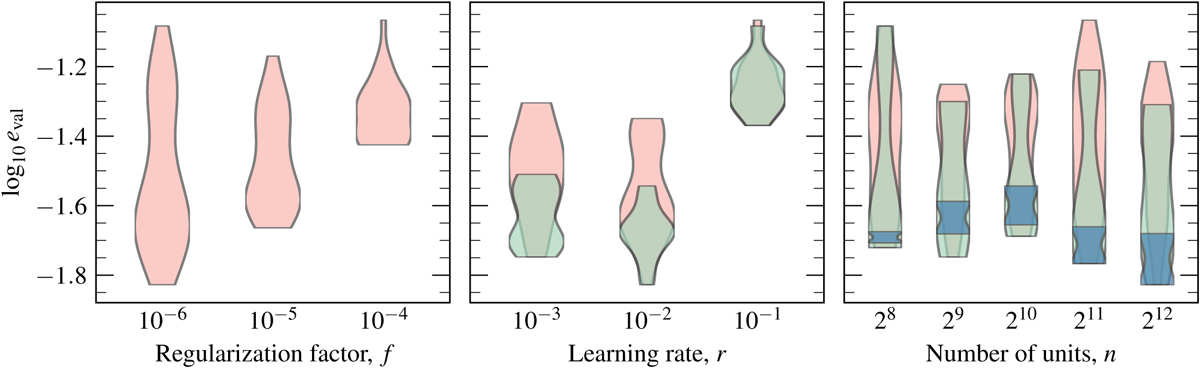
Distribution of the validation mean absolute errors of the models trained during the hyperparameter tuning. Left panel: dependence on the regularisation factor (pink), with f = 10−6 indicated as the optimal value. Middle panel: dependence on the learning rate (pink). The distribution highlights the trials with the optimal f value (green) and indicates optimal performance for r = 0.01. Right panel: dependence on the number of units (pink). The distribution highlights the trials with the optimal f (green) and r values (blue). The green violin plots focus on the models with the best performing regularisation factor, f = 106, while the blue ones also focus on those with the best performing learning rate, r = 0.01.
Current usage metrics show cumulative count of Article Views (full-text article views including HTML views, PDF and ePub downloads, according to the available data) and Abstracts Views on Vision4Press platform.
Data correspond to usage on the plateform after 2015. The current usage metrics is available 48-96 hours after online publication and is updated daily on week days.
Initial download of the metrics may take a while.