Fig. 7
Download original image
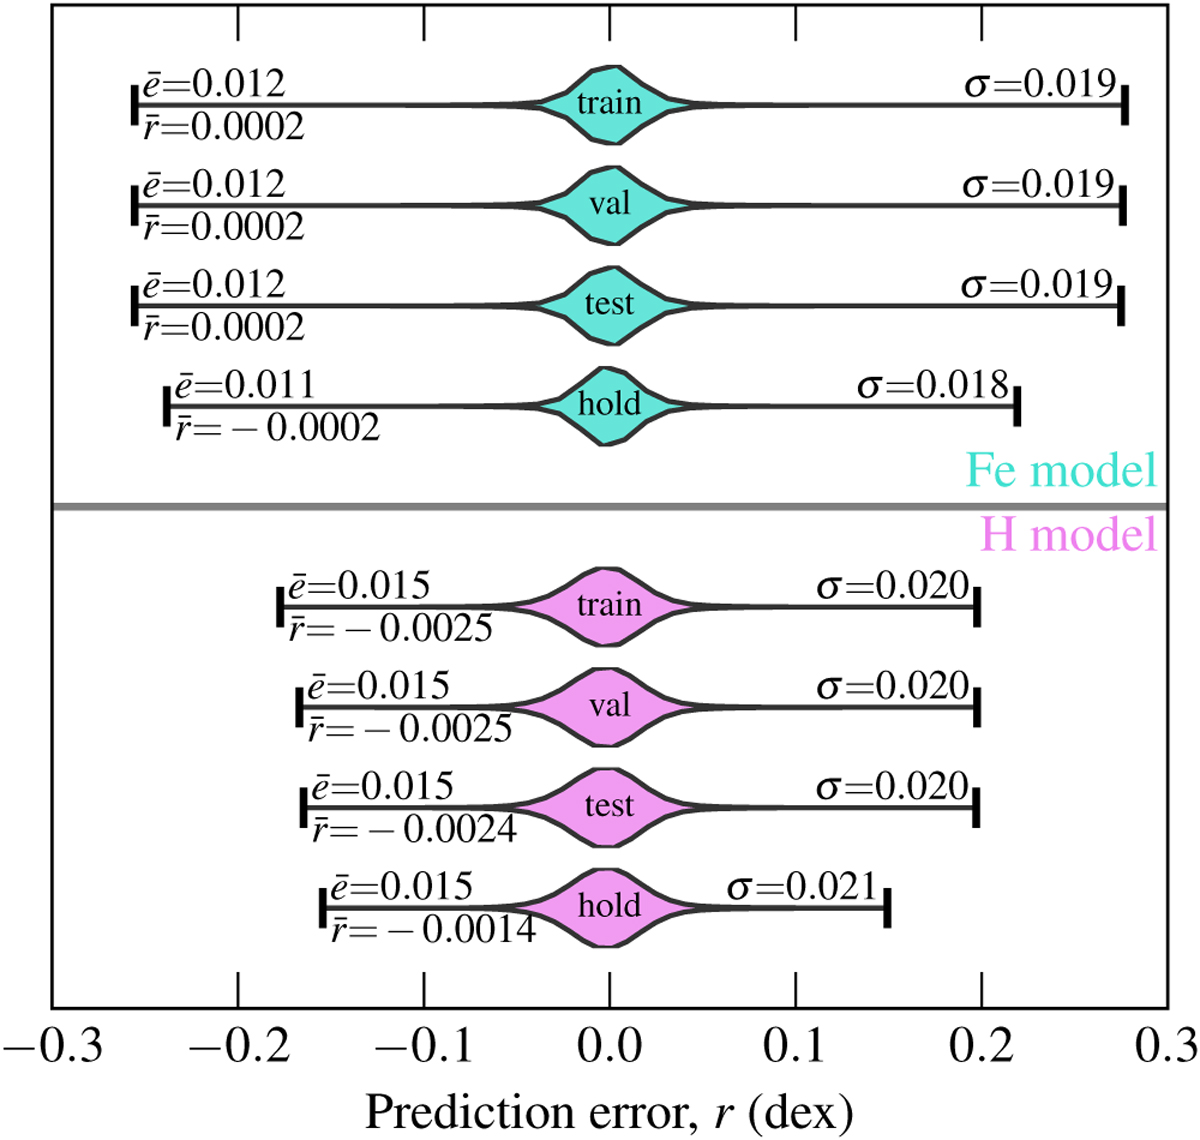
Distribution of the prediction errors, r = y−ŷ, of the final models for Fe (upper part) and H (lower part) in the different sets (from top to bottom): training (‘train’), validation (‘val’), test (‘test’), and holdout curves (‘hold’). The standard deviation of the prediction errors (σ), their mean value (r̄ i.e. the mean bias of the predictions), and mean absolute values (ē; i.e. the mean absolute error) are shown in the tails of the violin plots.
Current usage metrics show cumulative count of Article Views (full-text article views including HTML views, PDF and ePub downloads, according to the available data) and Abstracts Views on Vision4Press platform.
Data correspond to usage on the plateform after 2015. The current usage metrics is available 48-96 hours after online publication and is updated daily on week days.
Initial download of the metrics may take a while.