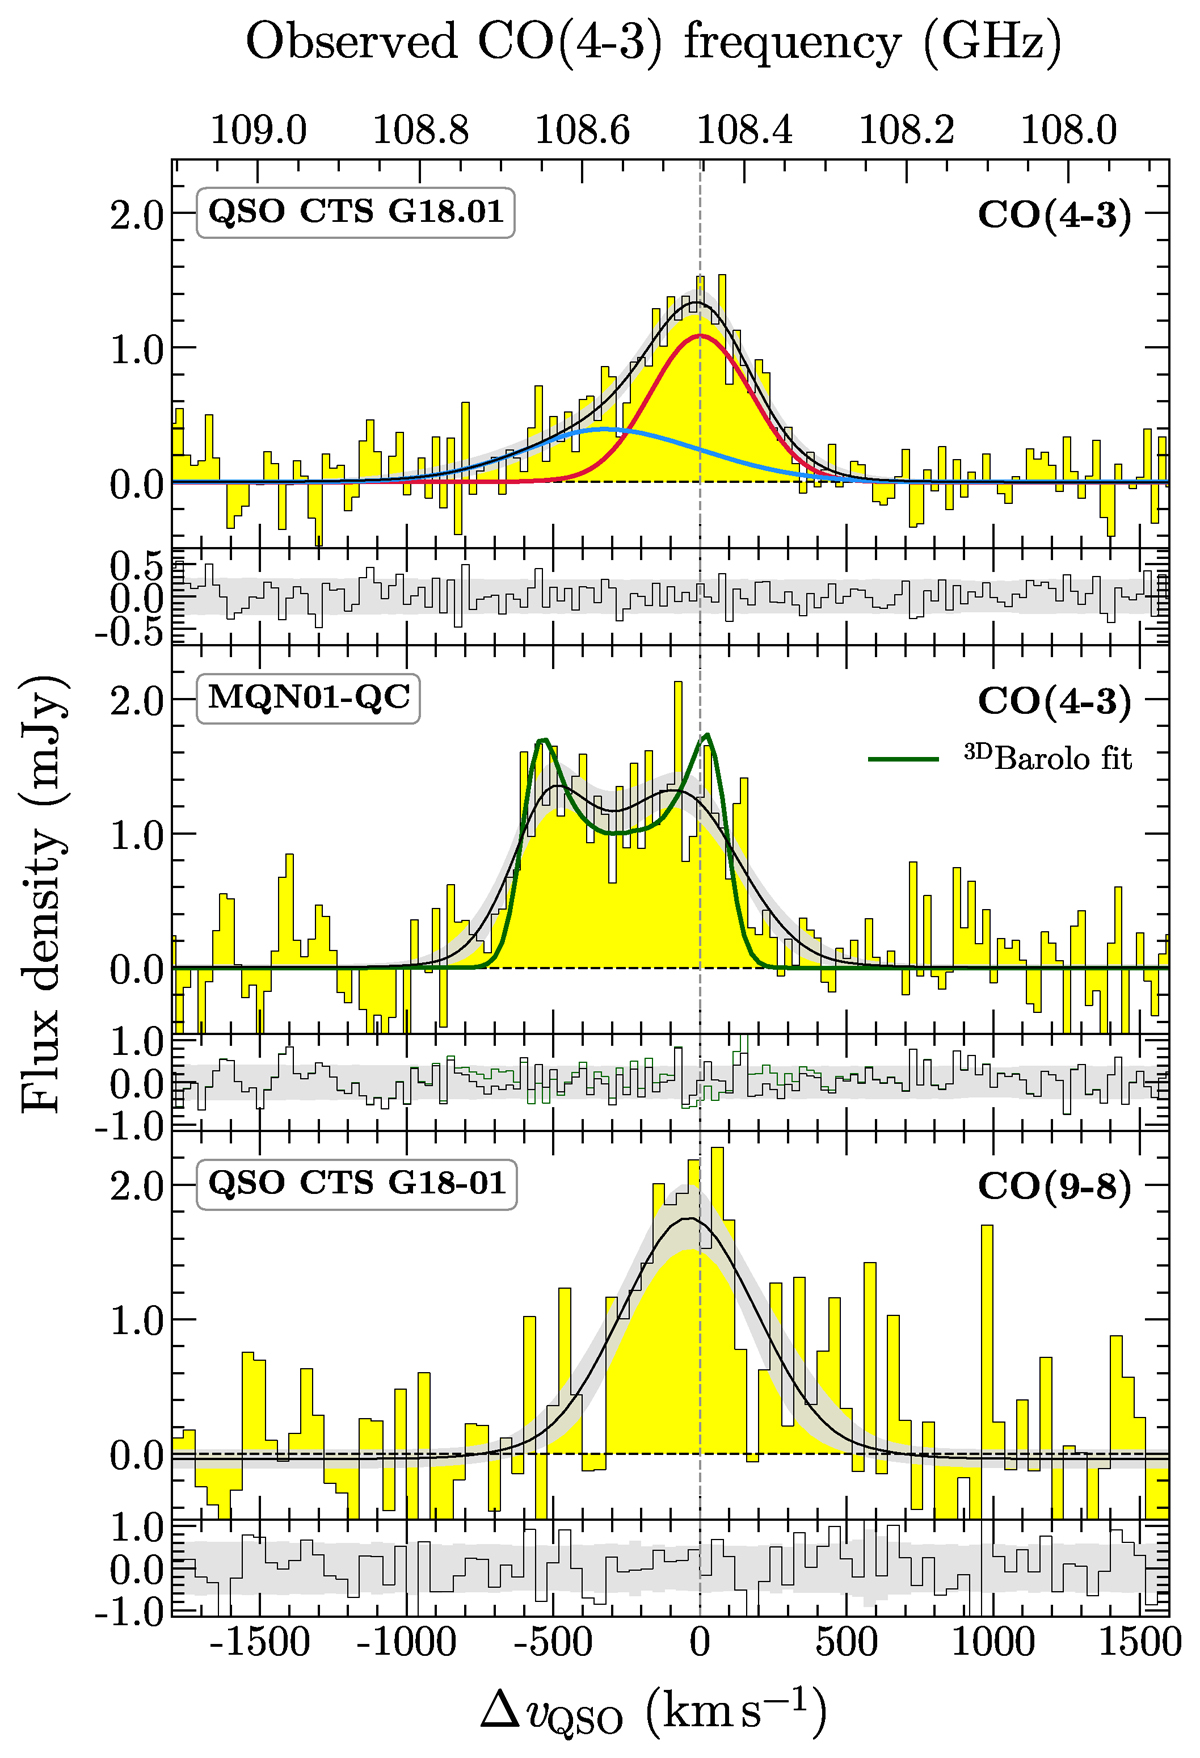
Fig. 2.
Download original image
Continuum-subtracted CO(4−3) and CO(9−8) line of the QSO CTS G18.01 host galaxy (top and bottom panel) and the CO(4−3) line of the MQN01-QC (central panel). The data are reported in yellow. The black solid line shows the best-fit model. The gray shaded area shows the 1σ confidence interval of the best-fit model. The individual Gaussian components are reported in red and blue for the quasar line profile. The green solid line in the central panel shows the line profile extracted from the best-fit rotating disk model as obtained with 3DBAROLO (see Sect. 4). The fit residuals (data − model) are also reported below each spectra, where the shaded area represents the noise RMS. The bottom velocity scale refers to the quasar systemic redshift as determined by the red component of the quasar CO(4−3) line profile.
Current usage metrics show cumulative count of Article Views (full-text article views including HTML views, PDF and ePub downloads, according to the available data) and Abstracts Views on Vision4Press platform.
Data correspond to usage on the plateform after 2015. The current usage metrics is available 48-96 hours after online publication and is updated daily on week days.
Initial download of the metrics may take a while.