| Issue |
A&A
Volume 701, September 2025
|
|
|---|---|---|
| Article Number | A120 | |
| Number of page(s) | 16 | |
| Section | Extragalactic astronomy | |
| DOI | https://doi.org/10.1051/0004-6361/202554769 | |
| Published online | 05 September 2025 | |
ALMA survey of a massive node of the Cosmic Web at z ∼ 3
II. A dynamically cold and massive disk galaxy in the proximity of a hyper-luminous quasar
1
Dipartimento di Fisica “G. Occhialini”, Università degli Studi di Milano-Bicocca, Piazza della Scienza 3, I-20126 Milano, Italy
2
DARK, Niels Bohr Institute, University of Copenhagen, Jagtvej 155, 2200 Copenhagen, Denmark
3
Kapteyn Astronomical Institute, University of Groningen, Landleven 12, NL-9747 AD Groningen, The Netherlands
4
Dipartimento di Fisica, Università di Trieste, Sezione di Astronomia, Via G. B. Tiepolo 11, I-34131 Trieste, Italy
5
INAF–Osservatorio Astronomico di Trieste, Via G. B. Tiepolo 11, I-34131 Trieste, Italy
6
Institute of Theoretical Astrophysics, University of Oslo, P.O. Box 1029 Blindern, 0315 Oslo, Norway
7
INAF–Osservatorio di Astrofisica e Scienza dello Spazio, Via Gobetti 93/3, I-40129 Bologna, Italy
⋆ Corresponding author: This email address is being protected from spambots. You need JavaScript enabled to view it.
Received:
26
March
2025
Accepted:
19
July
2025
Abstract
Advancing our understanding of the formation and evolution of early massive galaxies and black holes requires detailed studies of dense structures in the high-redshift Universe. In this work, we present high angular resolution (≃0.″3) ALMA observations targeting the CO(4−3) line and the underlying 3 mm dust continuum toward the Cosmic Web node MQN01, a region identified through deep multiwavelength surveys as having one of the densest concentrations of galaxies and active galactic nuclei at cosmic noon. At the center of this structure, we identified a massive, rotationally supported disk galaxy located approximately at a projected-distance of ∼10 kpc and ∼ − 300 km s−1 from a hyper-luminous quasar at z = 3.2510. By accurately modeling the cold gas kinematics, we determined a galaxy dynamical mass of 2.5 × 10¹¹ M⊙ within the inner ≃4 kpc and a high degree of rotational support of Vrot/σ ≈ 11. This makes it the first quasar companion galaxy confirmed as a massive, dynamically cold rotating disk at such an early cosmic epoch. Despite the small projected separation from the quasar host, we find no clear evidence of strong tidal interactions affecting the galaxy disk. This might suggest that the quasar is a satellite galaxy in the early stages of a merger. Furthermore, our spectroscopic analysis revealed a broad, blueshifted component in the CO(4−3) line profile of the quasar host, which may trace a powerful molecular outflow or kinematic disturbances induced by its interaction with the massive companion galaxy. Our findings show that rotationally supported cold disks are able to survive even in high-density environments of the early Universe.
Key words: galaxies: evolution / galaxies: halos / galaxies: high-redshift / galaxies: kinematics and dynamics / quasars: supermassive black holes / submillimeter: galaxies
© The Authors 2025
 Open Access article, published by EDP Sciences, under the terms of the Creative Commons Attribution License (https://creativecommons.org/licenses/by/4.0), which permits unrestricted use, distribution, and reproduction in any medium, provided the original work is properly cited.
This article is published in open access under the Subscribe to Open model. This email address is being protected from spambots. You need JavaScript enabled to view it. to support open access publication.
1. Introduction
Luminous quasi-stellar objects (QSOs) at high redshifts (z > 2) are among the most powerful sources in the early Universe (< 3 Gyr). They are sustained by rapid gas accretion onto a central supermassive black hole (BH; MBH ≳ 108 M⊙), a process that is accompanied by intense star formation episodes in the host galaxies of the QSOs: star-formation rate (SFR) ≳100 M⊙ yr−1 (see, e.g., Pitchford et al. 2016; Harris et al. 2016; Duras et al. 2017). These properties point toward high-redshift quasars residing in massive structures of the dark matter (DM) density distribution, which are often associated with galaxy overdensities – though results in the literature remain mixed (see, e.g., García-Vergara et al. 2017; Uchiyama et al. 2018; Arrigoni Battaia et al. 2023). These environments promote efficient gas accretion from the Cosmic Web, alongside galaxy interactions, mergers, and feedback processes, ultimately driving the assembly of the most massive galaxies observed in the present-day Universe (e.g., Dekel et al. 2009a,b). Studying quasar environments, particularly at z ∼ 2 − 3, near the peak of galaxy and BH formation (Madau & Dickinson 2014; Richards et al. 2006; Kulkarni et al. 2019), is therefore crucial to understanding the complex mechanisms regulating the baryon cycle in early massive galaxies. The James Webb Space Telescope (JWST) has been game-changing in this endeavor, enabling efficient and sensitive surveys of quasar fields down to z ∼ 7 and frequently revealing megaparsec-scale structures of clustered galaxies (see, e.g., Kashino et al. 2023; Eilers et al. 2024). However, due to the high luminosity of quasars (up to Lbol > 1048 erg s−1), they can outshine any nearby sources within a few kiloparsecs, thus making detailed studies of their immediate surroundings challenging – even for JWST (e.g., Marshall et al. 2021; Ding et al. 2022, 2023; Stone et al. 2023). (Sub)millimeter observations are particularly effective in these cases, that is, when the flux contrast between quasars and proximate sources is unfavorable. The Atacama Large (sub-)Millimeter Array (ALMA) has been pivotal in this regard, unveiling companion galaxies near quasars at cosmic noon (see, e.g., Bischetti et al. 2018, 2021; Fogasy et al. 2020; Banerji et al. 2021) and beyond (e.g., Decarli et al. 2017, 2019; Trakhtenbrot et al. 2017; Neeleman et al. 2019; Venemans et al. 2019; Fudamoto et al. 2021). Many of these studies have revealed tidal interactions and disturbed kinematics of the cold interstellar medium (ISM) – either in the quasar host or its surroundings – suggesting that such interactions may fuel BH growth and star formation at high redshift (see, e.g., Alexander & Hickox 2012). Importantly, mergers and interactions can trigger both nuclear activity and starbursts (see, e.g., Urrutia et al. 2008; Volonteri et al. 2015; Anglés-Alcázar et al. 2017), potentially driving powerful outflows that reshape galaxy properties (see, e.g., Carniani et al. 2015; Zakamska et al. 2016; Bischetti et al. 2017, 2019a; Herrera-Camus et al. 2020).
In this work, we report the discovery and characterization of a massive rotating disk galaxy near the hyper-luminous QSO CTS G18.01 at z ≈ 3.25 (see Deconto-Machado et al. 2023). The galaxy (hereafter MQN01-QC), lies ∼1″ south of the quasar, within the MQN01 field (MUSE Quasar Nebula 01; see Borisova et al. 2016). This field hosts one of the highest known concentrations of galaxies and active galactic nuclei (AGNs) uncovered through deep multiwavelength surveys (Pensabene et al. 2024; Galbiati et al. 2025; Travascio et al. 2025), and it has been found to be connected by Cosmic Web filaments revealed via Lyα emission across ∼4 cMpc (Cantalupo et al., in prep.). This system represents an ideal laboratory to study the assembly of the progenitors of today’s most massive galaxies in a dense region of the early Universe.
In Pensabene et al. (2024, hereafter Paper I), the first results were presented from an ALMA survey targeting tracers of galaxy ISM, including carbon monoxide (CO) rotational transitions and millimeter dust continuum over ∼2 arcmin2 around the quasar. The relatively low resolution of these mosaic observations ( ) caused the quasar host and its companion (previously dubbed Object B in Paper I) to appear blended, preventing spatially resolved analysis. Here, we present new results obtained from an ALMA band 3 single-pointing observation targeting the CO(4−3) line at a much higher resolution (
 ) toward the inner ∼150 kpc around the quasar.
This paper is structured as follows. In Sect. 2 we describe the observations and the reduction of the data. In Sect. 3 we measure fluxes and luminosities and derive molecular gas masses and dust characteristics of the system. We present the morphological and kinematical analysis in Sect. 4, and we discuss our results in Sect. 5. Finally, in Sect. 6 we summarize our findings and draw our conclusions.
Throughout this paper we assume a standard ΛCDM cosmology with H0 = 67.7 km s−1 Mpc−1, Ωm = 0.310, and ΩΛ = 1 − Ωm from Planck Collaboration VI (2020). With these parameters, an angular diameter of 1″ corresponds to a physical scale of about 7.69 kpc at z = 3.25.
2. Observations and data processing
2.1. Description of ALMA observations
In this work, we employed data from the ALMA Cycle 8 program 2021.1.00793.S (PI: S. Cantalupo) that includes ALMA band 3 and 6 low-resolution ( ) mosaics, as well as a band 3 single-pointing observation at higher angular resolution (
 ) covering the central part of the MQN01 structure. The ALMA band 3 and 6 data were designed to target the CO(4−3) and CO(9−8) line (rest-frame frequencies 461.041 and 1036.912 GHz, respectively) in galaxies around z ≃ 3.2, as well as the underlying 3 mm and 1.2 mm (rest-frame wavelengths 706 and 282 μm, respectively) dust continuum, respectively. Data acquisition and processing of the mosaics are described in Paper I to which we refer for full details. The single pointing observation is centered at the coordinates ICRS 00:41:32.273 −49:36:19.604. The half power beam width (HPBW) of individual ALMA 12m antennas at the reference frequency of 109.00 GHz is
  . The frequency setup consists of four 1.875-GHz-wide spectral windows (SPWs). We disposed two adjacent SPWs in the upper side band (USB) centered respectively at 107.198 GHz and 109.00 GHz, and other two in the lower side band (LSB) covering the frequency range 94.06 − 97.74 GHz contiguously. The native spectral resolution of the acquired data is 1.95 MHz channel−1 (∼5.4 km s−1 channel−1 at 109.00 GHz). The observations were executed in four blocks during the period 2021 November 13−14, employing a total on-source exposure time of ≈4.97 h. The number of ALMA main array antennas ranged from 42 to 49, with baselines within 41.4 − 3638.2 m. The weather conditions during executions provided a mean precipitable water vapor in the range 0.7 − 1.2 mm. The nominal achieved sensitivity is 64 μJy beam−1 over a bandwidth of 36.358 MHz (≃100 km s−1), and 4.5 μJy beam−1 over the aggregate continuum in the 6.78 GHz bandwidth. During the observations, the quasars J0025−4803, J2357−5311 were employed as a phase and flux calibrator, respectively.
2.2. Reduction and imaging of ALMA data
We performed the reduction and processing of the raw visibilities by utilizing the Common Astronomy Software Application (CASA; McMullin et al. 2007; Hunter et al. 2023). We performed standard calibration of the measurement sets by running the scriptForPI delivered by the ALMA observatory, using the CASA pipeline version 6.2.1. We then imaged the ALMA band 3 visibilities with the CASA task tclean employing the Högbom deconvolution algorithm (Högbom 1974), and adopting a “natural” weighting scheme of the visibilities to maximize the surface brightness sensitivity per beam. This procedure yielded a naturally weighted beam size and position angle at 109.00 GHz of  and −86.18 deg, respectively. The resulted angular resolution corresponds to ≃2.3 kpc at z = 3.25.
We made an initial inspection of the data where we obtained a “dirty” datacube by Fourier-transforming the raw visibilities with the tclean task setting niter = 0, specmode=“cube” as a spectral definition mode and a channel width of 25 km s−1. Similarly, we obtained a “dirty” 3 mm continuum image by aggregating all four SPWs by running tclean with niter = 0 in multifrequency synthesis mode (specmode=“mfs”). We imaged the visibilities by using a pixel size of  , thus achieving sufficient sampling of the beam minor axis with ∼7 pixels.
In this dataset, we detected the quasar host and the MQN01-QC companion galaxy, in both their CO(4−3) line and the underlying 3 mm dust continuum. They are revealed with an on-sky projected separation of ∼1″ (see Fig. 1). No additional galaxy emission was detected in the field of view. Hence, we obtained the “cleaned” datacube and line-free continuum image by cleaning down to a threshold of 1.5σ within two circular masks of  radius. These were sufficient to encompass the observable emission of both the sources. Finally, we obtained a continuum-subtracted datacube by employing the CASA task imcontsub. In this procedure, we fit with a zeroth-order polynomial and subtract the line-free channels in the image domain within 20″ × 20″ rectangular mask around the sources.
 |
Fig. 1. Images of the MQN01-QC galaxy located ∼10 kpc south of the hyper-luminous QSO CTS G18.01 at z ≈ 3.2. Left panel: JWST/NIRCam F322W2 snapshot (Wang et al. 2025). Central panel: Same as the left panel but with two rounds of quasar light removal (QSO − PSF). The result, shown in the lower-right half of the image below the dotted demarcation line provides a remarkably clearer view of the galaxy (indicated by the circle) compared to the original image on the left. Details about the light removal and stellar mass estimation are described in Sects. 2.4 and 3.4, respectively. Similar steps were conducted to the NIRCam F150W2 filter image. Right panel: ALMA 3 mm dust continuum image. The dashed gray lines indicate the nominal location of the sources as derived from the peak of the dust continuum. The dotted and solid contours in the ALMA map correspond to −2σ and [3, 2n]σ, respectively, where n > 1 is an integer, and σ denotes the noise RMS. The ALMA synthesized beam is shown as a yellow ellipse in the bottom right corner. |
2.3. Ancillary datasets
In this work, we capitalized on the low-resolution ALMA band 6 mosaic observations toward the MQN01 field reported in Paper I. This includes cleaned continuum image and datacube with a channel width of 40 km s−1, and naturally weighted beam sizes of  , and
, and  at the reference frequency of 245.00 GHz, respectively. In this dataset, we detected the continuum emission at 1.2 mm from both the sources, and the CO(9−8) line from the quasar host galaxy.
Additionally, we benefit from photometric observations acquired by the JWST/NIRCam (Rigby et al. 2023), as a part of the program GO 1835 (PI: Cantalupo; Wang et al. 2025), using the extra-wide filters F150W2 and F322W2 in the short- and long-wavelength channel, respectively. These images cover a field of view of 2 × 5 arcmin2, encompassing the sky area of the ALMA observations, with an on-source exposure time of 1632 sec per filter. The data described here may be obtained from the MAST archive at https://dx.doi.org/10.17909/cn46-tk72
2.4. Quasar light removal from JWST/NIRCam images
In the acquired JWST images, the MQN01-QC galaxy appears outshone by the central quasar emission but still visible in both NIRCam filters (see Fig. 1). We performed optimal subtraction of the quasar point-spread function (PSF) by employing a bright star in the field. The alignment and flux scaling of the star were made by comparing the locations and brightnesses of the light spikes of the star and quasar in each filter (Ren et al. 2024). A residual light was present in the cutout around the quasar after this initial round of PSF removal (“iter 1” in Fig. 1, central panel). These residuals are most likely caused by the mismatch between the quasar and the star light profile due to their different spectral shapes (Ren et al. 2024). In order to minimize the light residuals, we mirrored the upper half of the image where no bright additional source is apparent, and subtracted it from the lower half where the galaxy is located. We note that this step also removes the large-scale background of any nature. We report the resulting image as “iter 2” in Fig. 1 (central panel), which provides remarkably clearer view of the galaxy and its extended morphology compared to the original image (left panel). We conducted similar steps on the NIRCam F150W2 filter image.
3. Characterization of the quasar host–companion galaxy system
3.1. Flux and luminosity measurements from ALMA data
From the ALMA band 3 cleaned datacube, we extracted the CO(4−3) line emission of the sources by applying the 2σ-clipped photometry method (see, e.g., Béthermin et al. 2020; Pensabene et al. 2024), which enables recovery of the line flux with an optimal signal-to-noise ratio (S/N) while preventing significant flux losses. We first extracted the spectrum of the sources from the continuum-subtracted cleaned datacube at the peak pixel of the 3 mm dust continuum emission, corrected for the response of the primary beam (PB), and fit the line using a single Gaussian component. Then, we obtained the line-velocity integrated map (moment 0) by summing all the channels within ±2σ from centroid of the extracted line profile. Hence, we extracted a new spectrum including the signal from all the pixels encompassed by the S/N ≥ 2 isophote. We then divided the spectrum by the synthesized beam area (in pixel units) and computed the noise by multiplying the peak flux uncertainty (in mJy beam−1) by the square root of the independent beam elements over the extracting region. Finally, we repeated the line fit on this new spectrum as described above, and we iterated the procedure until convergence.
The observed CO(4−3) line profiles of our sources cannot be adequately reproduced with a single Gaussian component. Indeed, the CO(4−3) line of the quasar host galaxy exhibits a broad blueshifted tail that need to be modeled (see Fig. 2). This feature suggests the presence of a non-circular gas kinematic component. On the other hand, the CO(4−3) line of MQN01-QC exhibits a boxy double-peaked profile. This type of line profile is often observed in rotating disks with significant inclination angle (see, e.g., Elitzur et al. 2012; de Blok & Walter 2014; Kohandel et al. 2019, 2024).
 |
Fig. 2. Continuum-subtracted CO(4−3) and CO(9−8) line of the QSO CTS G18.01 host galaxy (top and bottom panel) and the CO(4−3) line of the MQN01-QC (central panel). The data are reported in yellow. The black solid line shows the best-fit model. The gray shaded area shows the 1σ confidence interval of the best-fit model. The individual Gaussian components are reported in red and blue for the quasar line profile. The green solid line in the central panel shows the line profile extracted from the best-fit rotating disk model as obtained with 3DBAROLO (see Sect. 4). The fit residuals (data − model) are also reported below each spectra, where the shaded area represents the noise RMS. The bottom velocity scale refers to the quasar systemic redshift as determined by the red component of the quasar CO(4−3) line profile. |
We inspected the ALMA band 6 datacube and detect spatially unresolved CO(9−8) line emission from the quasar host galaxy. In this case, we measured the line flux by applying a standard single-pixel analysis. We therefore extracted the line flux from the peak pixel of the emission and corrected for the PB response at the corresponding location. We report the extracted spectra in Fig. 2. Interestingly, the CO(9−8) line of the quasar host lacks of similar blueshifted wing as observed in the CO(4−3) line profile1. This indicates that the latter component is associated with molecular gas exposed to different physical conditions and excitation mechanisms than that traced by the bulk of the CO(4−3) emission – which is expected to be retained within the ISM of the quasar host galaxy. Indeed, while the low-J CO(4−3) transition is a tracer of the cold molecular gas, the CO(9−8) is a high-J CO rotational transition which is typically associated with high-density2 and/or high-temperature molecular gas exposed to strong X-ray radiation field or heated by shocks produced by AGN-driven outflows (e.g., Maloney et al. 1996; Meijerink et al. 2013; Vallini et al. 2019; Pensabene et al. 2021).
Following the aforementioned considerations, we performed a more accurate fit of the CO line profiles by employing a composite double and single Gaussian model for the CO(4−3) and CO(9−8) lines, respectively, using the Python Markov chain Monte Carlo (MCMC) ensemble sampler emcee package (Foreman-Mackey et al. 2013). In the fitting procedure, we adopted Gaussian uncertainties in the definition of the likelihood and flat priors on the free parameters such as amplitudes, full widths at half maximum (FWHMs), and line centroids. Finally, we derived the line luminosities as (see, e.g., Solomon et al. 1997)
![Mathematical equation: $$ \begin{aligned} L_{\rm CO}\,[L_{\odot }]&= 1.04\times 10^{-3} \,F_{\rm CO}\,\nu _{\rm obs}\,D_{\rm L}^{2},\end{aligned} $$](/articles/aa/full_html/2025/09/aa54769-25/aa54769-25-eq11.gif) (1)
(1)
![Mathematical equation: $$ \begin{aligned} L\prime _{\rm CO}\,[\mathrm{K\,km\,s^{-1}\,pc^{2}}]&= 3.25\times 10^{7}\,F_{\rm CO}\,\frac{D_{\rm L}}{(1+z)^{3}\,\nu _{\rm obs}^{2}}, \end{aligned} $$](/articles/aa/full_html/2025/09/aa54769-25/aa54769-25-eq12.gif) (2)
(2)
where FCO is the velocity-integrated line flux obtained with the Gaussian fit (see Table 1) in units of Jy km s−1, νobs = νrest/(1 + z) is the observed central frequency of the line in GHz at the redshift z, and DL(z) is the luminosity distance in Mpc. The two luminosity measurements are related via 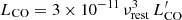 . We report best-fit models, parameters, and the derived quantities in Fig. 2, and Table 1. For the subsequent analysis, we adopt as systemic velocity of the system, the observed line centroid of the narrow component of the quasar CO(4−3) line profile.
Line and continuum flux measurements, luminosity estimates, and derived quantities of the sources.
We measured the 3 mm continuum flux of the sources. To do so, we added together the fluxes of individual pixels above the S/N ≥ 2 isophote in the continuum map, divided by the beam size in pixels, and corrected the total flux for the PB response at the location of the galaxies. We also computed the flux uncertainties by rescaling the noise root mean square (RMS) of the image by the PB response, and multiplying by the square-root of the number of independent beams within the S/N ≥ 2 region. For sake of completeness, in Table 1 we report both the 3 mm and 1.2 mm continuum measurements derived in this work and in Paper I, respectively.
3.2. CO(4–3) line flux distributions and velocity fields
In Fig. 3 we show the moment maps of the system. Specifically, we obtained the line velocity-integrate map (0th moment) by integrating channels within [ − 700; +400] km s−1 around the quasar systemic redshift, in order to include all the CO(4−3) emission from both the quasar host and MQN01-QC galaxy (see Fig. 2). We obtained the line-of-sight velocity field (moment 1st), and the velocity dispersion field (moment 2nd), by collapsing channels after masking voxels in the cube with S/N < 2.
 |
Fig. 3. CO(4−3) line-velocity integrated map (moment 0, left panel), line-of-sight velocity field (Vlos, moment 1, central panel), and line-of-sight velocity dispersion field (σlos, moment 2, right panel) of the quasar host–MQN01-QC galaxy system. These maps are obtained from the continuum-subtracted ALMA datacube using channels within [ − 700; +400] km s−1 around the quasar systemic redshift (Vlos = 0). The dotted (negative) and solid (positive) contours correspond to [ − 2, 3, 2n]σ, where n ≥ 2 is an integer, and σ denotes the noise RMS. The white crosses mark the peak emission of the 3 mm dust continuum. The 3σ contour of the 0th moment is also reported in the moment 1st and 2nd maps. The ALMA synthesized beam is shown in the bottom right corner. |
As is evident from Fig. 3, our analysis reveals very distinct characteristics of the two sources. The CO(4−3) line emission of the quasar host is relatively compact in the observed size and shows a radially declining flux distribution, similar to the morphology observed in the dust continuum at 3 mm (see Fig. 1). The velocity field of the quasar host appears irregular. Although there is a hint of a velocity gradient along the E-W direction, with the current data it is difficult to determine with certainty if the observed gradient is a signature of rotation. The emission line of the MQN01-QC galaxy is instead resolved into two separated “clumps”, deviating from the morphology revealed in the continuum. This suggests that the molecular gas throughout the galaxy disk is distributed in a complex structures – such as spiral arms. Similar structures have been also highlighted by other (sub-)millimeter observations of high-redshift galaxies and quasar hosts (see, e.g., Walter et al. 2004; Riechers et al. 2009; Tacconi et al. 2010; Hodge et al. 2012, 2019; Iono et al. 2016; Tadaki et al. 2018; Roman-Oliveira et al. 2023). Alternatively, the observed morphology as traced by the CO(4−3) emission of the MQN01-QC galaxy could result from significant molecular gas depletion or optically thick line emission in the galaxy central region compared to its outskirts. Furthermore, Fig. 3 reveals a possible elongation of the cold gas distribution on the west side of the MQN01-QC disk, which may suggest that part of the gas is being stripped, possibly due to the interaction with the surrounding environment. However, this feature seems to do not significantly impact the global ordered kinematics characterizing the velocity field. Notably, the gas kinematics of the MQN01-QC galaxy shows a clear velocity gradient along the south-north direction which, at a first guess, is totally consistent with rotation. Finally, the observed velocity dispersion, although not yet corrected for beam smearing effect, is relatively low (see Sect. 4.1.2). All of these lines of evidence indicate that the molecular gas in the MQN01-QC galaxy is settled in a rotationally supported disk. This is somehow surprising given the small projected separation and, therefore, the possible interaction with the quasar host galaxy in its vicinity (see Sect. 5.2).
3.3. Molecular gas mass and dust characteristics
From the available CO(4−3) line luminosities, we estimated the molecular gas content of the galaxies. To this purpose, assumptions on the CO(4−3)-to-CO(1−0) conversion factor (L′CO(1 − 0) = L′CO(4 − 3)/r41), and the αCO coefficient are needed (MH2 = αCOL′CO(1 − 0); see Bolatto et al. 2013, for a review). Here, we adopt a recent estimate of the CO-to-H2 conversion factor derived for a sample of local ultra-luminous infrared galaxies as αCO = 1.7 ± 0.5 M⊙ (K km s−1 pc2)−1 (Montoya Arroyave et al. 2023), and r41 = 0.87 typical of quasar hosts and sub-millimeter galaxies (SMGs) (Carilli & Walter 2013), and obtain  , and
, and  for the MQN01-QC and the quasar host galaxy, respectively. The latter decreases to
  when accounting only for the systemic component of the quasar CO(4−3) line profile. Finally, we provide an estimate of the bulk of the molecular gas mass in the quasar host galaxy. To do so, we employed the total CO line luminosity and subtracted the fraction associated with the blue side (≤300 km s−1) of the broad line component. Thus, by adopting the same assumptions as above, we obtained
  . We report these estimates in Table 2. Here, we note that the reported uncertainties on molecular gas masses do not take into account systematic uncertainties on the assumed conversion factors.
Mass budgets, dust characteristics, and morphological sizes of the quasar host and the MQN01-QC galaxy.
We estimated the dust mass (Mdust) of galaxies by performing the modeling of the Rayleigh-Jeans (RJ) tail of dust spectral energy distribution (SED) traced by the available 3 mm and 1.2 mm continuum measurements. To this purpose, we assumed a modified black body emission of the dust grains in optically thin limit (see, e.g., Beelen et al. 2006; Casey 2012; Leipski et al. 2013; Decarli et al. 2022), and took into account the contrast effect due to the cosmic microwave background (CMB) via the relation (see da Cunha et al. 2013; Zhang et al. 2016)
![Mathematical equation: $$ \begin{aligned} F_{\nu /(1+z)}^\mathrm{obs} = \frac{1+z}{D_{\rm L}^{2}}\,M_{\rm dust}\,\kappa _{\nu }\left(B_{\nu }[T_{\rm dust}(z)]-B_{\nu }[T_{\rm CMB}(z)]\right). \end{aligned} $$](/articles/aa/full_html/2025/09/aa54769-25/aa54769-25-eq65.gif) (3)
(3)
In Eq. (3), Tdust(z), and TCMB(z), are the temperature of the dust and the CMB at redshift z, respectively, and κν is the dust mass opacity coefficient defined as κν = κ0(ν/ν0)β where β is the dust spectral index. Here, we assumed κν = 0.077 m2 kg−1 at 850 μm from Dunne et al. (2000).
We performed the fit of the dust RJ tail by minimizing the log-likelihood function assuming Gaussian uncertainties on measurements, and exploring the parameter space through the emcee (Foreman-Mackey et al. 2013) Python package, adopting flat priors on Mdust and β. Due to the lack of continuum measurements near to the peak of the dust SED, we were able to put only shallow constraints on the dust temperature. For this reason, we performed the fit by assuming two different Gaussian priors for the Tdust, the value of which we centered at 35 K, typical of SMGs at z ∼ 1 − 3.5 (see, e.g., Chapman et al. 2005; Kovács et al. 2006; Dudzevičiūtė et al. 2020), and at 45 K, typical of z ∼ 2 − 5 quasar host galaxies (see, e.g., Duras et al. 2017; Bischetti et al. 2021; Tripodi et al. 2024), assuming a standard deviation on the dust temperature priors as σ(Tdust) = 5 K. In Fig. 4, we show the data, the best-fit models as well as the posterior distributions of free parameters. We report our results in Table 2.
 |
Fig. 4. Dust SED modeling of the quasar host (red circles) and the MQN01-QC galaxy (blue diamonds). The solid and dashed lines show the best-fit modified blackbody models for different assumptions on the dust temperature. The 1σ confidence intervals on the best fit are reported with shaded areas. The inset corner plot shows the posterior probability distributions of the free parameters for the quasar host (red) for Tdust = 45 K and the MQN01-QC (blue) for Tdust = 35 K. |
We computed the total infrared luminosities (LFIR) by integrating the best-fit dust SED models in the rest-frame wavelength range 8 − 1000 μm, and we inferred the IR-based SFR by using the scaling relation for local galaxies (Murphy et al. 2011)3: SFRIR (M⊙ yr−1) = 1.49 × 10⁻¹⁰LFIR/L⊙. We note that, under our working assumptions, any possible contribution from the central AGN to the measured FIR luminosity would result in an overestimation of the SFRIR. For the subsequent analysis, we adopted fiducial values assuming Tdust = 45 K for the quasar host, and Tdust = 35 K for MQN01-QC, in line with expectation from previous aforementioned works.
Finally, we modeled the 3 mm continuum morphology of both galaxies using a 2D elliptical Gaussian by running the CASA task imfit. This simple model is sufficient to reproduce well the observed dust distribution in both galaxies. As a result, we found an intrinsic (beam-deconvolved) 3 mm half-light radius4 of R1/2, 3 mm = 0.14 ± 0.03 arcsec (or 1.1 ± 0.2 kpc), and 0.29 ± 0.04 arcsec (or 2.2 ± 0.3 kpc) for the quasar host and MQN01-QC galaxy, respectively. We report these measurements in Table 2.
3.4. Stellar mass estimation of MQN01-QC from JWST/NIRCam images
We derived an estimate of the stellar mass (M⋆) of MQN01-QC galaxy by using the available JWST/NIRCam images with QSO PSF and background subtracted (denoted as “iter 2” in Sect. 2.4). We acquired photometric measurements of the MQN01-QC emission within a circular aperture  (corresponding to R1/2, 3 mm of the source; see Sect. 3.3, and Fig. 1), which is substantially larger than the resolution of NIRCam images (i.e.,
  and
and  for 1.5- and 3.2-μm NIRCam filter, respectively). As a result, we obtained f1.5 μm = 0.159 ± 0.009 μJy, and f3.2 μm = 1.57 ± 0.02 μJy5. Interestingly, we note that the galaxy appears to be an exceptionally red object, more than ∼10× brighter in the 3.2 μm than in the 1.5 μm filter, reminiscent of some of the reddest galaxies recently discovered at similar or higher redshifts (see, e.g., Xiao et al. 2023). We estimated its stellar mass using an empirical calibration between the mass-to-light ratio at 3.2 μm and the galaxy flux ratio f3.2 μm/f1.5 μm (or, equivalently, the color index MF150W2 − MF322W2). We briefly summarize our method here. (i) We collected the sample of all star-forming galaxies in MQN01 protocluster field with available stellar mass estimates derived through SED fitting as described in Galbiati et al. (2025). (ii) We measured the fluxes of these galaxies in the 1.5- and 3.2-μm JWST/NIRCam images using identical apertures after matching the image PSF. (iii) We derived the best-fit model calibration by minimizing the scatter in the log-linear relation log [(M⋆/M⊙)/(f3.2 μm/mJy)] = a × log (f3.2 μm/f1.5 μm)+b. Through this method, we obtained the best calibration, a = 1.20 and b = 12.56, and found that the galaxy stellar mass can be predicted from the f3.2 μm/f1.5 μm flux ratio to an accuracy of 0.05 dex (see also Kouroumpatzakis et al. 2023, for a similar approach). By applying this calibration for the observed flux ratio of log (f3.2 μm/f1.5 μm) = 0.97 ± 0.03 measured for MQN01-QC, we derived a galaxy stellar mass (within the inner
  or < 2.3 kpc) of
  , where we also report in parentheses the systematic uncertainty associated with the galaxy SED fitting assumptions as quantified by Pacifici et al. (2023). We report this measurement in Table 2. This value of the galaxy stellar mass, in combination with the estimated SFRIR (see Sect. 3.3) place the MQN01-QC above to the star-forming main sequence at z ≈ 3 (Popesso et al. 2023), thus suggesting that the galaxy is in a dust-obscured starburst phase6. Nevertheless, we note that this estimate is only accurate in terms of order-to-magnitude, considering the photometric systematic uncertainties originating from the quasar light subtraction and the lack of flux measurements from other filters.
4. Kinematical analysis
In this work, we perform a full kinematical modeling of the MQN01-QC galaxy. In what follows, we describe the details of our analysis and provide an estimate of the galaxy dynamical mass. On the other hand, despite a similar analysis on the quasar host galaxy remains challenging without higher angular resolution ALMA observations, we provide virial estimates of its dynamical mass.
4.1. Rotating disk modeling of the MQN01-QC
We measured the geometry and kinematics of the MQN01-QC disk by employing the forward modeling technique through 3DBAROLO (3D-Based Analysis of Rotating Objects via Line Observations; Di Teodoro & Fraternali 2015)7, in combination with CANNUBI (Center and Angles via Numerical Nous Using Bayesian Inference; Roman-Oliveira et al. 2023)8. Below we summarize the main characteristics of the codes. 3DBAROLO creates 3D realizations of a tilted-ring model (Rogstad et al. 1974). Through this procedure, a galaxy is subdivided in concentric rings, each with its geometry and kinematics determined by the center (x0, y0), the inclination (i) and position angle (PA), the vertical thickness (z0), the systemic velocity (Vsys), the rotation velocity (Vrot), the radial velocity in the disk midplane (Vrad), and the velocity dispersion (σdisp). Under thin disk assumption (z0 ≈ 0) with negligible radial motions (Vrad ≈ 0), the line-of-sight velocity at a given galactocentric radius (R) can be expressed as
 (4)
(4)
where ϕ is the azimuthal angle in the disk plane. From the disk model, 3DBAROLO creates a mock datacube that is then convolved with the PSF of the observations. This accounts for the beam smearing effect (Bosma 1978; Begeman 1987; Epinat et al. 2010), which is critical for a robust measurement of the intrinsic rotational velocity of disk galaxies, especially when observed at moderate or low spatial resolution. Finally, it performs the fit to the real data by minimizing the residuals.
The galaxy kinematical model of 3DBAROLO is determined by a set of free parameters, including those for the geometry of the disk. However, the limited S/N and angular resolution of the current data hamper a simultaneous determination of all the free parameters. For this reason, we employed CANNUBI for a robust beforehand determination of the geometry of the galaxy disk. The code makes use of 3DBAROLO to generate mock datacube and total flux maps obtained from models with different parameters, and hence it minimizes residuals between the data and the models via a Bayesian MCMC algorithm. In this way, CANNUBI is able to retrieve robust best-fit estimates and uncertainties of the disk geometry, such as the coordinates of the center, the radial extent, the thickness, the position angle, and the inclination. In particular, the disk inclination angle is crucial for accurately estimating the intrinsic rotation velocity, as it strongly influences the line-of-sight velocity correction (see Eq. 4). In this work, we assume a razor-thin disk model and therefore that the observed galaxy geometry is entirely due to the projection of an intrinsically round disk on the sky plane. Under these assumptions, the inclination is directly determined by sin2i = 1 − (bmin/amaj)2, where amaj and bmin are the semimajor and semiminor axes of the intrinsic galaxy disk model, respectively. In the next sections, we describe our methods and findings.
4.1.1. Geometrical parameter derivation
We ran CANNUBI on the continuum-subtracted datacube of MQN01-QC by minimizing the sum of |data−model| using three annuli (NRADII = 3). These are sufficient to cover the entire emitting line region (∼1″ extension) given the resolution of the data ( ). We set errorType=“marasco”, which calculates the likelihood taking into account the asymmetries in the total intensity map (i.e., the moment 0th; see Marasco et al. 2019). For the masking, we first applied a smoothing to a 1.5× lower resolution and then scan the smoothed data for sources building the mask with MASK=“SMOOTH&SEARCH” task adopting FACTOR = 1.5, and SNRCUT = 3, GROWTHCUT = 2 as primary and secondary S/N threshold, respectively. In Table 3, we report the best fit values and uncertainties obtained from the posterior probability distributions of the free parameters. We also show the posteriors in Appendix A. In Fig. 5, we show the best fit model overlaid with the data.
 |
Fig. 5. Geometrical and kinematical modeling results as obtained with CANNUBI and 3DBAROLO. Left panel: Observed CO(4−3) line-velocity integrated map overlaid with the best-fit model. The black and red contours show the [4, 16]σ isophotes of the data and the model, respectively, where σ denotes the noise RMS in the flux map. The dashed gray lines indicate the best-fit location of the major and minor axes of the disk. The white circles show the spacing between the model rings. The ALMA synthesized beam is reported in the bottom right corner. Central and right panels: Position-velocity diagrams along the best-fit major and minor axis of the model. The black and red contours show the [2, 4]σ isophotes of the data and the best-fit rotating thin-disk model, respectively, where σ is the noise RMS per velocity channel. |
Geometrical and kinematical best-fit parameters of the MQN01-QC galaxy disk.
4.1.2. Kinematical parameter derivation
We ran 3DBAROLO on the continuum-subtracted datacube of MQN01-QC. We employed the same mask parameters and three annuli with fixed radial separation, inclination, and position angle corresponding to the best-fit values as derived from the morphological fit with CANNUBI, and we left the rotational velocity (VROT), and the velocity dispersion (VDISP) as free parameters. We set the systemic velocity at the CO(4−3) line redshift of z = 3.24759. We also assumed negligible radial velocity (Vrad = 0), as the isovelocity curves of the CO-traced gas appear to be not significantly distorted (see, e.g., Lelli et al. 2012a,b)10. Finally, we employed an axisymmetric disk normalization by setting NORM=“AZIM”. With this assumption, the surface density of each ring is computed directly from the observed flux map using an azimuthal average. Although the observed CO(4−3) disk in the MQN01-QC is not perfectly axisymmetric, this option enables a robust determination of the rotational velocity in the outer rings, which is a proxy for the enclosed dynamical mass of the galaxy. Through 3DBAROLO, we minimized the absolute difference between the data and the model employing cos2ϕ as weighting function WFUNC = 2. This choice gives prominence to regions close to the major axis, which enclose most of the information on the rotational motion. In Table 3, we report the best-fit values for the maximum rotational velocity (Vrot, max) and the radially averaged velocity dispersion ( ). We note that the reported uncertainties do not take into account those on geometry.
In Figs. 2 and 5, we compare, respectively, the line profile and the position-velocity diagrams (PVDs) along the major and minor axis of the best-fit disk model, with the observed data of the MQN01-QC galaxy. The PVD along the major axis is well reproduced by our rotating disk model, which has a steeply rising rotation curve. The observed emission in the minor-axis PVD seems slightly asymmetric. This is most likely an effect of the low S/N, rather than a signature of radial motions. The vertical extend of the emission is captured by our model, which indicates that the velocity dispersion is robustly determined. Overall, the kinematics of the MQN01-QC is broadly reproduced by the rotating thin-disk model with no strong evidence of non-circular motions. This is also evident from the good match between data and model in the datacube channel maps (see Appendix B). Following a common approach used in literature (e.g., Förster Schreiber et al. 2018; Wisnioski et al. 2019; Lelli et al. 2023; Rizzo et al. 2020, 2024; Kohandel et al. 2024), we quantify the level of rotational support by computing the rotation-to-dispersion velocity ratio and obtained 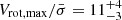 . This implies a high degree of rotational support for MQN01-QC.
We compare our findings with that obtained with a different kinematical analysis of the MQN01-QC galaxy disk using the parametric code GALPAK3D11. The details about this code are described in Bouché et al. (2015). Briefly, GALPAK3D is a Bayesian parametric modeling tool which makes use of reverse deconvolution method and employs MCMC procedure to recover the intrinsic geometrical and kinematical properties of a galaxy. The code is optimized for low S/N and angular resolution observations. We modeled the MQN01-QC datacube with GALPAK3D by adopting a Gaussian profile for both the radial and the vertical flux distribution of the disk. We employed an arctangent model as the intrinsic rotation velocity curve of the form Vrot(R) = Vmax(2/π)arctan(R/Rt). For the fit, we fixed the disk geometrical center, position angle, and inclination to the those obtained with CANNUBI. We left as free parameters the maximum rotation velocity (Vmax), the turnover radius (Rt), the intrinsic velocity dispersion (σ0), and the systemic velocity of the disk, as well as its half-light radius (R1/2), and the flux profile normalization. As a result, we find that the kinematical parameters are consistent within the uncertainties with those retrieved with 3DBAROLO (see Tables 2 and 3).
4.2. Dynamical and virial mass estimates of galaxies
We used our measurements of the disk radial extent and maximum circular velocity to estimate the dynamical mass (Mdyn) of MQN01-QC galaxy. Under the assumption that the mass distribution is spherically symmetric, the dynamical mass enclosed within a radius R, is given by
![Mathematical equation: $$ \begin{aligned} M_{\rm dyn}({ < }R)\,[M_{\odot }] = \frac{{v}^{2}_{\rm circ}}{G}R = 2.33\times 10^{5}\,\left(\frac{{v}_{\rm circ}}{\mathrm{km\,s^{-1}}}\right)^{2} \left(\frac{R}{\mathrm{kpc}}\right), \end{aligned} $$](/articles/aa/full_html/2025/09/aa54769-25/aa54769-25-eq83.gif) (5)
(5)
where G is the gravitational constant and vcirc is the circular velocity. The latter is evaluated from the rotational velocity taking into account the contribution from random motions (see, e.g., Epinat et al. 2009; Burkert et al. 2010; Turner et al. 2017; Iorio et al. 2017; Lelli et al. 2023). Since Vrot/σ ∼ 10 for the MQN01-QC disk, this implies negligible pressure support, thus making vcirc ≈ Vrot. We note that the approximation of spherically mass distribution is likely an oversimplification in our case, as the baryonic disk component is expected to be dominant in such inner regions of galaxies. Under our assumptions, we expect the mass measurement to be overestimated by ∼30% at most (see, e.g., Binney & Tremaine 2008; Price et al. 2022). Therefore, following Neeleman et al. (2021), we conservatively included a 20% level of uncertainty toward lower mass in order to take into account this potential systematic. Given the aforementioned considerations, we estimated a dynamical mass of the MQN01-QC galaxy within the observed radial extent of  .
.
For the quasar host, we estimate the galaxy virial mass under the assumption of dispersion-dominated system through the virial relation GMvir ≈ kσR2. Here, the constant k is intended to account for the “degree of virialization” (see, e.g., Cappellari et al. 2006; Taylor et al. 2010; van der Wel et al. 2022). Following Decarli et al. (2018), who estimated virial masses of a large sample of z > 6 quasar host galaxies, we employ k = 3/2. For σ, we use the width of the systemic component of the CO(4−3) line profile (see Table 1), in order to exclude potential non-virialized structures (blueshifted component in Fig. 2). To estimate the size of the quasar host galaxy, we modeled the CO(4−3) line map with a 2D Gaussian using the CASA task imfit and found a beam-deconvolved major and minor axis FWHM of amaj = 0.34 ± 0.04 arcsec and bmin = 0.27 ± 0.04 arcsec, respectively. This corresponds to a radial extent of 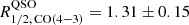 kpc at z = 3.2510. We report such measurement in Table 2. We note that this size is consistent within the uncertainties with the half-light radius of quasar host galaxy as measured from the 3 mm continuum emission (see Sect. 3.3). This suggests that the distribution molecular gas and dust have comparable extension. By using these assumptions and estimates, we find
  .
.
Alternatively, in the extremely opposite case in which the bulk of the emitting gas is dominated by regular rotation, we estimate the quasar host dynamical mass through the relation Mdyn = G−1R (0.75 × FWHM/sin i)2 (see, e.g., Ho 2007; Wang et al. 2013; Willott et al. 2015; Decarli et al. 2018). Similarly to above, we use as FWHM the linewidth of the quasar CO(4−3) systemic component. Finally, we estimated the galaxy inclination angle through the axial ratio as i = cos−1(bmin/amaj) = 40 ± 10 deg, and found  .
.
We note that, given the limited angular resolution of the observations, the above virial mass estimates suffer from large uncertainties and should be taken with caution. However, they can be used as a first guess of the dynamical mass of the quasar host galaxy (see Pensabene et al. 2020; Neeleman et al. 2021, for further discussion). Taken at face values, our estimates suggest that the quasar host galaxy might be comparably or at most ∼10× less massive than the closely separated MQN01-QC galaxy. The observed system may constitute a early-stage galaxy merger. In this scenario, if the quasar host dynamical mass matches the estimate for a dispersion dominated system, it would likely act as the satellite of its companion galaxy. We further discuss this hypothesis in Sect. 5.2.
5. Discussion
5.1. Comparison with other cold disks across cosmic time
Numerous lines of evidence shows that massive star-forming galaxies detected with ALMA can be settled in rotationally supported disks even in the early Universe (e.g., Neeleman et al. 2020; Rizzo et al. 2020, 2023, 2024; Fraternali et al. 2021; Lelli et al. 2021, 2023; Ginolfi et al. 2022; Roman-Oliveira et al. 2024; Rowland et al. 2024), rather than being characterized by irregular morphologies and strong turbulent motions, as expected by some theoretical models as a consequence of interaction or intense gas accretion (see Hopkins et al. 2014; Schaye et al. 2015; Vogelsberger et al. 2020). Our kinematical analysis shows that, despite residing in the immediate proximity of a hyper-luminous quasar within one of the most significant galaxy overdensity identified at cosmic noon (see Paper I; Galbiati et al. 2025; Travascio et al. 2025), MQN01-QC exhibits a high level of rotational support ( ) comparable to that of other dynamically cold rotating disks at similar redshifts (see, e.g., Rizzo et al. 2024). Our finding suggests that cold disks are able to survive even in such a hostile environment, where galaxy interactions, mergers, and ram-pressure stripping may disrupt ordered gas kinematics.
In Fig. 6, we compare the velocity dispersion and the rotational support measurements of the MQN01-QC galaxy disk with the empirical relations from Rizzo et al. (2024). The latter has been derived from samples of main-sequence and starburst galaxies observed primarily through CO lines. We found that our kinematical measurements for MQN01-QC galaxy are in full agreement with the observed evolution of turbulence across cosmic time. Rizzo et al. (2024) show that the observed evolutionary trends can be explained by models for turbulence driven by stellar feedback (see also Bacchini et al. 2020; Fraternali et al. 2021). We apply this model on the MQN01-QC to estimate the efficiency of the supernovae in transferring kinetic energy to the molecular gas. We employ Equation (10) in Rizzo et al. (2024), and the MH2 and SFR measurements from Table 2. We further adopt a supernova rate of  , and a disk scale height of h = 0.2 kpc (see Bacchini et al. 2024). Under these assumptions, we found ϵSN ≃ 0.05, implying that only 5% of the kinetic energy from supernova feedback is needed to drive the observed turbulence in MQN01-QC disk. This result is fully in line with the typical values measured from cold gas kinematics in dusty star-forming galaxies (DSFGs) at z ≳ 3 (Rizzo et al. 2020, 2021; Roman-Oliveira et al. 2024).
 |
Fig. 6. Redshift distribution of the mean velocity dispersion (left panel) and the degree of rotational support (right panel) for a sample of main-sequence and starburst galaxy disks. Data points are taken from Rizzo et al. (2020, 2021, 2023, 2024), Fraternali et al. (2021), Girard et al. (2021), and Roman-Oliveira et al. (2023), who analyzed galaxy cold gas kinematics traced by CO emission lines. The |

In Fig. 7, we compare the rotation curve of the MQN01-QC galaxy and other DSFG disks at z ∼ 3 − 4 from the literature, including also the velocity curves derived for two giant spiral galaxies recently discovered in protocluster environments at z ∼ 3 (Umehata et al. 2025; Wang et al. 2025). The MQN01-QC galaxy disk reaches a maximum value of ∼500 km s−1 at ≃4 kpc which is much higher than the typical Vrot, max measured in DSFGs at z ∼ 3 − 4 (see, e.g., Rizzo et al. 2020, 2021; Lelli et al. 2023; Roman-Oliveira et al. 2023; Amvrosiadis et al. 2025). Interestingly, the MQN01-QC rotation curve resembles those of two z ≃ 4.5 starburst galaxies reported by Fraternali et al. (2021). Notably, Fraternali et al. (2021) found that, assuming all their gas is converted to stars, these systems overlap with the massive early-type galaxies (ETGs) at z = 0, on the ETG analog of the stellar-mass Tully-Fisher relation (Tully & Fisher 1977; Davis et al. 2016). In other words, there is a dynamical evidence of an evolutionary link between massive high-redshift starbursts and ETGs. We do the same experiment by adopting 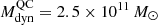 (see Table 2) as an upper limit on the baryonic mass budget of the MQN01-QC galaxy, and find that MQN01-QC galaxy falls within the same parameter space of local ETGs. This suggests that MQN01-QC could indeed represent one of the progenitors of today’s most massive ellipticals.
 |
Fig. 7. Velocity curves of z ≳ 1.5 main-sequence and starburst galaxy disks from Rizzo et al. (2020, 2021), Fraternali et al. (2021), Lelli et al. (2023), Roman-Oliveira et al. (2023) and those of giant spiral galaxies discovered in z ∼ 3 protoclusters (ADF22.A1, Umehata et al. 2025, and Big Wheel, Wang et al. 2025). The MQN01-QC velocity curve as derived in this work is indicated by the blue diamond. |
5.2. Origin of the blueshifted emission of the quasar host galaxy
The observed blueshifted component detected in the CO(4−3) line profile of the quasar host galaxy (see Fig. 2), may be explained by two main possible scenarios: (1) a tidal tail generated by the interaction between the quasar host and its MQN01-QC companion galaxy; or (2) a molecular gas outflow driven by the quasar. In this section we test these scenarios to determine which one best matches our observations.
We firstly inspect the datacube to search for any evidence of gas tails or “bridges” that might be indicative of interactions between galaxies and/or with the surrounding medium. In Fig. 8, we report the PVD extracted from a slit connecting the quasar host and the MQN01-QC galaxy. Through this method, we detect – albeit tentatively (S/N ≳ 1) – blueshifted gas emission traced by the CO(4−3) line up to line-of-sight velocities of approximately −900 km s−1, which appears also stretched toward the approaching side of the MQN01-QC galaxy. We also note that we did not detect a similar feature in the CO(9−8) line emission of the quasar host galaxy, which seems to be mostly associated with the CO(4−3) systemic component. This evidence, alongside the close projected distance between between the galaxies, might support the idea that tidal interactions are actively occurring in this system. The high degree of rotational support of the MQN01-QC disk, and the tentative dynamical mass estimates (see Sect. 4.2), indicate that this system may constitute a minor merger in progress where the MQN01-QC would represent the most massive galaxy (i.e., the primary) of the system which is inducing strong gravitational disturbances on the quasar host (i.e., the satellite).
 |
Fig. 8. Search for gas emission around galaxies. Top panel: Line emission components of the system. Background image and gray contours represent the total CO(4−3) and CO(9−8) intensity map, respectively. These are obtained within ΔvQSO = [ − 700; +400] km s−1. The red and blue contours on the quasar host galaxy show residual line maps after subtracting from the CO(4−3) total flux map, the blueshifted [ − 900, −300] km s−1, and the systemic [ − 300, +400] km s−1 image component, respectively. The contours correspond to [3, 2n]σ, with n > 1 is an integer number, and σ denotes the noise RMS. The contours on the MQN01-QC shows instead the isovelocity curves (blue: [ − 500, −350] km s−1; white: [ − 300, −150] km s−1; red: [ − 100, 50] km s−1). The synthesized beam of the band 6 and 3 observations are reported with the gray hatched and filled ellipse at the bottom right corner, respectively. Bottom panel: PVD extracted along the black ( |


To further test this hypothesis we compute the tidal radius of the MQN01-QC galaxy (RJ) and that of the quasar host (rJ), under the hypotheses of spherically symmetric gravitational potentials and that galaxies are moving on circular orbits around the center of mass of the two-body system12. We further assume a conservative (i.e., lower limit) real-space physical separation between the galaxies of 10 kpc, and the (virial) dynamical masses derived in Sect. 4.2 as estimates of the total mass of the individual galaxies. With this set of assumptions, and taking into account the possible range for the dynamical mass of the quasar host, we found RJ ≃ 7.8 − 5.5 kpc, and rJ ≃ 2.1 − 4.5 kpc. Conversely, we may ask which should be the minimum mass of the quasar host in order to induce strong tidal disturbances on the MQN01-QC galaxy disk. To this purpose, we employ our dynamical estimate of the mass of MQN01-QC, and its radial extent as rJ. This yields a minimum mass of the quasar host of ≃5 × 10¹¹ M⊙, which is larger than the our virial mass estimates. Taken at face values, the above estimates indicate that tidal effects are expected to be negligible in this system. This is in contrast with our intuitions based on Fig. 8. However, we emphasize that these arguments should be taken with caution since they rely on highly simplifying assumptions which are difficult to verify. Furthermore, an accurate dynamical analysis is limited by projection effects and lack of information regarding the total mass (dark matter + baryons) of the individual galaxies. Indeed, the galaxy mass estimates we derived in Sect. 4.2 do not account for the remaining mass budget distributed at larger distances outside the radius probed by the detected CO(4−3) emission. In conclusion, our analysis shows that with the current available information, we cannot completely rule out the tidal stripping scenario, albeit the latter is not supported by our simplified calculation discussed above.
Next, we consider the outflow scenario. The CO(4−3) blue wing may indeed trace outflowing gas from the front side of the quasar host. This interpretation is also supported by the observation of a broad blueshifted [OIII]λ5007 line (FWHM of ∼1500 km s−1 and velocity shift of ∼ − 500 km s−1) in the near-IR spectrum of the quasar as found by Deconto-Machado et al. (2023, see their Figure A.3), which would possibly imply the presence of a ionized gas outflow. The velocity shift (∼ − 300 km s−1) and FWHM (∼700 km s−1) of the broad component that we revealed in the CO(4−3) line profile of the quasar host, is consistent with the typical velocities of molecular outflows observed in nearby AGNs (see, e.g., Feruglio et al. 2010; Veilleux et al. 2013; Cicone et al. 2012, 2014; Bischetti et al. 2019b; Fluetsch et al. 2019), and high-redshift quasars (see, e.g., Polletta et al. 2011; Feruglio et al. 2017; Brusa et al. 2018; Bischetti et al. 2019a, 2024; Vayner et al. 2021). Following these previous works, we compute the molecular gas outflow rate via  (see Rupke et al. 2005), where
  , vout, and Rout are the molecular gas mass, the maximum velocity of the outflow, and its spatial extension. To compute the molecular gas mass within the outflow we adopted a CO(4−3)-to-CO(1−0) line luminosity ratio of r41 = 0.87 (Carilli & Walter 2013), and a conservative αCO = 0.5 M⊙ (K km s−1 pc2)−1. The latter CO-to-H2 conversion factor has been measured in the molecular outflow of M82 and is widely adopted in the literature to compute the molecular mass of outflowing gas in high-redshift quasar host galaxies (Weiß et al. 2001; Feruglio et al. 2010, 2017; Cicone et al. 2014).
We considered only the blue side of the broad component at velocities of ≤300 km s−1 as the CO emitting gas associated with the outflow. We therefore took into account only half of the broad-line luminosity. We further adopt vout ≃ 770 km s−1 as the 95th percentile of the cumulative velocity distribution of the broad line component, and assume  as the outflow extension (see Sect. 4.2, and Table 2). Under these hypotheses, we obtain an estimate of the molecular gas outflow rate of
  . This value places the outflow along the empirical relation for AGN winds (Fiore et al. 2017; Bischetti et al. 2019b) considering that the estimated quasar bolometric luminosity is LBol = 1.8 × 1048 erg s−1 (Deconto-Machado et al. 2023). The depletion timescale associated with this outflow – i.e., the timescale needed to clear out the whole gas content of the galaxy – would be
  Myr, when accounting for the bulk of the molecular gas within the quasar host (see Sect. 3.3). This value is ∼10× shorter than the time needed for the molecular gas to be converted into stars (τSF = MH2/SFRIR ≃ 150 Myr), implying that the outflow is potentially able to significantly affect the evolution of the quasar host galaxy, quenching the star formation in a relatively short timescale. Similar evidence has been also reported in other works investigating molecular outflows in AGNs (see, e.g., Cicone et al. 2014; Veilleux et al. 2017; Brusa et al. 2018; Herrera-Camus et al. 2019). Overall, the outflow scenario is a viable explanation to the observed broad blueshifted component observed in the quasar CO(4−3) line profile, but we cannot rule out any of the two alternative scenarios (i.e., merger or outflow) with the available information.
Finally, we note that a molecular gas inflow from a low-mass satellite galaxy, along one or more cosmic web filaments, or from the circumgalactic medium (see, e.g., Emonts et al. 2023) would potentially explain the observed blueshifted CO(4−3) emission. These latter scenarios, however, are difficult to test with the current data. Deeper and higher angular resolution observations in the (sub)millimeter band with ALMA targeting tracers of the cold atomic/molecular gas, and near-IR mapping with integral field spectrographs such as JWST/NIRSpec are therefore required to further investigate the origin of the blueshifted component, and to better understand the dynamic of the system.
6. Summary and conclusions
In this work, we have presented high-resolution ( ) ALMA band 3 observations targeting the CO(4−3) emission line and the underlying 3 mm dust continuum toward a closely separated (∼10 kpc) quasar host–companion galaxy pair at z ∼ 3. This system resides within a massive node of the Cosmic Web hosting one of the densest concentrations of galaxies and AGNs discovered so far at cosmic noon (Pensabene et al. 2024; Galbiati et al. 2025; Travascio et al. 2025).
Our accurate kinematical analysis revealed that the quasar companion (MQN01-QC) is a dynamically cold disk with a high degree of rotational support ( ) and an estimated dynamical mass of ≃2.5 × 10¹¹ M⊙ within the inner ≃4 kpc. This makes MQN01-QC the most massive and fastest rotating disk galaxy observed in proximity to a hyper-luminous quasar. Although the galaxy resides in a “hostile” environment that could induce gravitational perturbations, the gas kinematics in the MQN01-QC galaxy does not deviate from that of an orderly rotating disk and is in line with the observed evolution of turbulence for disk galaxies across cosmic time. The small projected separation between the galaxies, combined with the absence of significant disturbances in the observed kinematics of the MQN01-QC galaxy disk, suggests that the quasar host may be a satellite galaxy in the early stages of a merger. The quasar host CO(4−3) emission exhibits a broad (∼700 km s−1), blueshifted (−300 km s−1) component, potentially tracing a massive molecular outflow or tidally disturbed gas caused by interaction with the massive companion galaxy.
Higher angular resolution ALMA data will be crucial to further resolving the cold gas distribution in this system and identifying possible merger signatures. Observations with higher sensitivity on large angular scales will be instrumental to investigating the presence of faint extended cold gaseous structures around these galaxies. Additionally, future JWST spectroscopic observations would help characterize the stellar population and ionized gas content and provide a more comprehensive view of this system.
The MQN01 field is a unique laboratory for investigating how dense environments influence galaxy assembly and BH growth at cosmic noon. Future studies carrying out systematic comparisons of the kinematical properties of galaxies across the field and cluster or protocluster environments, with a careful and consistent characterization of the properties of the environments in which galaxies reside (e.g., in terms of volume, galaxy density, and overdensity definitions) will offer valuable insights into the impact of the environment on the galaxy cold gas kinematics.
Assuming the same flux ratio between the systemic and broad component of the CO(4−3) line (see Table 1), a broad blueshifted CO(9−8) component with FWHM = 700 km s−1 is expected to have a peak flux of ≃0.9 mJy and therefore be detectable at the current sensitivity in the ALMA band 6 data in the spectrum of the quasar host galaxy.
The critical density, that is the rate at which collisional de-excitations equals the spontaneous radiative decay rate of the CO(4−3) and CO(9−8) transitions is ncrit ≃ 8.7 × 104 cm−3 and ≃8.7 × 105 cm−3, respectively (Schöier et al. 2005).
This recipe holds under the hypothesis that the entire Balmer continuum (i.e.,  ) is absorbed and re-irradiated by the dust in optically thin limit. Additionally, a Kroupa initial mass function (Kroupa 2001) is implicitly assumed, having a slope of −1.3, and −2.3 for stellar masses between 0.1 − 0.5 M⊙, and 0.5 − 100 M⊙.
The half-light radius for a Gaussian distribution is equivalent to half of the FWHM of the major axis.
The uncertainties on these flux measurements are derived from a corresponding empty aperture and do not take into account any potential systematic errors.
Here we assumed that any contribution from the unobscured star formation to the total SFR is negligible due to the very dusty nature of the MQN01 galaxy.
The code is publicly available at https://editeodoro.github.io/Bbarolo/
See https://www.filippofraternali.com/cannubi for full details.
This corresponds to the flux-weighted average redshift of the two Gaussian components of the CO(4−3) line profile model of MQN01-QC (see Table 1).
We note that the current S/N and angular resolution of the observations are insufficient to investigate the presence of potential radial motions. However, since the observed molecular gas kinematics is well reproduced by a purely rotating disk, we find no compelling evidence to support the presence of radial motions.
The code is publicly available at https://galpak3d.univ-lyon1.fr/doc/
Following Binney & Tremaine (2008), we computed the tidal radius of a satellite of mass m in the gravitational potential of a point-like mass M by finding numerically the saddle points of the effective two-body gravitational potential as
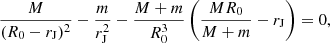 (6)
(6)
where M is mass of the primary, R0 is the physical separation between the two bodies, and rJ is the Jacobi radius (or tidal radius) of the satellite, that is the radius beyond which tidal interaction are expected to be dominant. The tidal radius of the primary can be found similarly by inverting M with m in the above equation or via RJ = R0 − rJ. We note that in our computation we consider the reference frame of the two body system as galaxies may have their own orbits in the protocluster potential.
Acknowledgments
We thank Dr. Bin Ren for his valuable suggestions on optimizing the quasar PSF removal and to Prof. Massimo Dotti for his insightful guidance on galaxy dynamics. This paper makes use of the following ALMA data: ADS/JAO.ALMA#2021.1.00793.S. ALMA is a partnership of ESO (representing its member states), NSF (USA) and NINS (Japan), together with NRC (Canada), MOST and ASIAA (Taiwan), and KASI (Republic of Korea), in cooperation with the Republic of Chile. The Joint ALMA Observatory is operated by ESO, AUI/NRAO and NAOJ. This work is based in part on observations made with the NASA/ESA/CSA James Webb Space Telescope. The data were obtained from the Mikulski Archive for Space Telescopes at the Space Telescope Science Institute, which is operated by the Association of Universities for Research in Astronomy, Inc., under NASA contract NAS 5-03127 for JWST. These observations are associated with program no. 1835. Support for program no. 1835 was provided by NASA through a grant from the Space Telescope Science Institute, which is operated by the Association of Universities for Research in Astronomy, Inc., under NASA contract NAS 5-03127. This project was supported by the European Research Council (ERC) Consolidator Grant 864361 (CosmicWeb) and by Fondazione Cariplo grant no. 2020-0902. CC has received funding from the European Union’s Horizon Europe research and innovation program under grant agreement No. 101188037 (AtLAST2). This research made use of Astropy (http://www.astropy.org), a community-developed core Python package for Astronomy (Astropy Collaboration 2013, 2018, 2022), NumPy (Harris et al. 2020), SciPy (Virtanen et al. 2020), Matplotlib (Hunter 2007).
References
- Alexander, D. M., & Hickox, R. C. 2012, New Astron. Rev., 56, 93 [Google Scholar]
- Amvrosiadis, A., Wardlow, J. L., Birkin, J. E., et al. 2025, MNRAS, 536, 3757 [Google Scholar]
- Anglés-Alcázar, D., Faucher-Giguère, C.-A., Quataert, E., et al. 2017, MNRAS, 472, L109 [Google Scholar]
- Arrigoni Battaia, F., Obreja, A., Chen, C. C., et al. 2023, A&A, 676, A51 [NASA ADS] [CrossRef] [EDP Sciences] [Google Scholar]
- Astropy Collaboration (Robitaille, T. P., et al.) 2013, A&A, 558, A33 [NASA ADS] [CrossRef] [EDP Sciences] [Google Scholar]
- Astropy Collaboration (Price-Whelan, A. M., et al.) 2018, AJ, 156, 123 [Google Scholar]
- Astropy Collaboration (Price-Whelan, A. M., et al.) 2022, ApJ, 935, 167 [NASA ADS] [CrossRef] [Google Scholar]
- Bacchini, C., Fraternali, F., Iorio, G., et al. 2020, A&A, 641, A70 [NASA ADS] [CrossRef] [EDP Sciences] [Google Scholar]
- Bacchini, C., Nipoti, C., Iorio, G., et al. 2024, A&A, 687, A115 [NASA ADS] [CrossRef] [EDP Sciences] [Google Scholar]
- Banerji, M., Jones, G. C., Carniani, S., DeGraf, C., & Wagg, J. 2021, MNRAS, 503, 5583 [Google Scholar]
- Beelen, A., Cox, P., Benford, D. J., et al. 2006, ApJ, 642, 694 [NASA ADS] [CrossRef] [Google Scholar]
- Begeman, K. G. 1987, Ph.D. Thesis, Kapteyn Institute [Google Scholar]
- Béthermin, M., Fudamoto, Y., Ginolfi, M., et al. 2020, A&A, 643, A2 [Google Scholar]
- Binney, J., & Tremaine, S. 2008, Galactic Dynamics: Second Edition (Princeton: Princeton University Press) [Google Scholar]
- Bischetti, M., Piconcelli, E., Vietri, G., et al. 2017, A&A, 598, A122 [NASA ADS] [CrossRef] [EDP Sciences] [Google Scholar]
- Bischetti, M., Piconcelli, E., Feruglio, C., et al. 2018, A&A, 617, A82 [NASA ADS] [CrossRef] [EDP Sciences] [Google Scholar]
- Bischetti, M., Maiolino, R., Carniani, S., et al. 2019a, A&A, 630, A59 [NASA ADS] [CrossRef] [EDP Sciences] [Google Scholar]
- Bischetti, M., Piconcelli, E., Feruglio, C., et al. 2019b, A&A, 628, A118 [NASA ADS] [CrossRef] [EDP Sciences] [Google Scholar]
- Bischetti, M., Feruglio, C., Piconcelli, E., et al. 2021, A&A, 645, A33 [NASA ADS] [CrossRef] [EDP Sciences] [Google Scholar]
- Bischetti, M., Choi, H., Fiore, F., et al. 2024, ApJ, 970, 9 [NASA ADS] [CrossRef] [Google Scholar]
- Bolatto, A. D., Wolfire, M., & Leroy, A. K. 2013, ARA&A, 51, 207 [CrossRef] [Google Scholar]
- Borisova, E., Cantalupo, S., Lilly, S. J., et al. 2016, ApJ, 831, 39 [Google Scholar]
- Bosma, A. 1978, Ph.D. Thesis, Groningen University [Google Scholar]
- Bouché, N., Carfantan, H., Schroetter, I., Michel-Dansac, L., & Contini, T. 2015, AJ, 150, 92 [Google Scholar]
- Brusa, M., Cresci, G., Daddi, E., et al. 2018, A&A, 612, A29 [NASA ADS] [CrossRef] [EDP Sciences] [Google Scholar]
- Burkert, A., Genzel, R., Bouché, N., et al. 2010, ApJ, 725, 2324 [Google Scholar]
- Cappellari, M., Bacon, R., Bureau, M., et al. 2006, MNRAS, 366, 1126 [Google Scholar]
- Carilli, C. L., & Walter, F. 2013, ARA&A, 51, 105 [NASA ADS] [CrossRef] [Google Scholar]
- Carniani, S., Marconi, A., Maiolino, R., et al. 2015, A&A, 580, A102 [NASA ADS] [CrossRef] [EDP Sciences] [Google Scholar]
- Casey, C. M. 2012, MNRAS, 425, 3094 [Google Scholar]
- Chapman, S. C., Blain, A. W., Smail, I., & Ivison, R. J. 2005, ApJ, 622, 772 [NASA ADS] [CrossRef] [Google Scholar]
- Cicone, C., Feruglio, C., Maiolino, R., et al. 2012, A&A, 543, A99 [NASA ADS] [CrossRef] [EDP Sciences] [Google Scholar]
- Cicone, C., Maiolino, R., Sturm, E., et al. 2014, A&A, 562, A21 [NASA ADS] [CrossRef] [EDP Sciences] [Google Scholar]
- da Cunha, E., Groves, B., Walter, F., et al. 2013, ApJ, 766, 13 [Google Scholar]
- Davis, T. A., Greene, J., Ma, C.-P., et al. 2016, MNRAS, 455, 214 [Google Scholar]
- de Blok, W. J. G., & Walter, F. 2014, AJ, 147, 96 [NASA ADS] [CrossRef] [Google Scholar]
- Decarli, R., Walter, F., Venemans, B. P., et al. 2017, Nature, 545, 457 [Google Scholar]
- Decarli, R., Walter, F., Venemans, B. P., et al. 2018, ApJ, 854, 97 [Google Scholar]
- Decarli, R., Dotti, M., Bañados, E., et al. 2019, ApJ, 880, 157 [Google Scholar]
- Decarli, R., Pensabene, A., Venemans, B., et al. 2022, A&A, 662, A60 [NASA ADS] [CrossRef] [EDP Sciences] [Google Scholar]
- Deconto-Machado, A., del Olmo Orozco, A., Marziani, P., Perea, J., & Stirpe, G. M. 2023, A&A, 669, A83 [NASA ADS] [CrossRef] [EDP Sciences] [Google Scholar]
- Dekel, A., Birnboim, Y., Engel, G., et al. 2009a, Nature, 457, 451 [Google Scholar]
- Dekel, A., Sari, R., & Ceverino, D. 2009b, ApJ, 703, 785 [Google Scholar]
- Di Teodoro, E. M., & Fraternali, F. 2015, MNRAS, 451, 3021 [Google Scholar]
- Ding, X., Silverman, J. D., & Onoue, M. 2022, ApJ, 939, L28 [NASA ADS] [CrossRef] [Google Scholar]
- Ding, X., Onoue, M., Silverman, J. D., et al. 2023, Nature, 621, 51 [NASA ADS] [CrossRef] [Google Scholar]
- Dudzevičiūtė, U., Smail, I., Swinbank, A. M., et al. 2020, MNRAS, 494, 3828 [Google Scholar]
- Dunne, L., Eales, S., Edmunds, M., et al. 2000, MNRAS, 315, 115 [Google Scholar]
- Duras, F., Bongiorno, A., Piconcelli, E., et al. 2017, A&A, 604, A67 [NASA ADS] [CrossRef] [EDP Sciences] [Google Scholar]
- Eilers, A.-C., Mackenzie, R., Pizzati, E., et al. 2024, ApJ, 974, 275 [NASA ADS] [CrossRef] [Google Scholar]
- Elitzur, M., Asensio Ramos, A., & Ceccarelli, C. 2012, MNRAS, 422, 1394 [NASA ADS] [CrossRef] [Google Scholar]
- Emonts, B. H. C., Lehnert, M. D., Yoon, I., et al. 2023, Science, 379, 1323 [NASA ADS] [CrossRef] [Google Scholar]
- Epinat, B., Contini, T., Le Fèvre, O., et al. 2009, A&A, 504, 789 [NASA ADS] [CrossRef] [EDP Sciences] [Google Scholar]
- Epinat, B., Amram, P., Balkowski, C., & Marcelin, M. 2010, MNRAS, 401, 2113 [Google Scholar]
- Feruglio, C., Aussel, H., Le Floc’h, E., et al. 2010, ApJ, 721, 607 [Google Scholar]
- Feruglio, C., Ferrara, A., Bischetti, M., et al. 2017, A&A, 608, A30 [NASA ADS] [CrossRef] [EDP Sciences] [Google Scholar]
- Fiore, F., Feruglio, C., Shankar, F., et al. 2017, A&A, 601, A143 [NASA ADS] [CrossRef] [EDP Sciences] [Google Scholar]
- Fluetsch, A., Maiolino, R., Carniani, S., et al. 2019, MNRAS, 483, 4586 [NASA ADS] [Google Scholar]
- Fogasy, J., Knudsen, K. K., Drouart, G., Lagos, C. D. P., & Fan, L. 2020, MNRAS, 493, 3744 [NASA ADS] [CrossRef] [Google Scholar]
- Foreman-Mackey, D., Hogg, D. W., Lang, D., & Goodman, J. 2013, PASP, 125, 306 [Google Scholar]
- Förster Schreiber, N. M., Renzini, A., Mancini, C., et al. 2018, ApJS, 238, 21 [Google Scholar]
- Fraternali, F., Karim, A., Magnelli, B., et al. 2021, A&A, 647, A194 [NASA ADS] [CrossRef] [EDP Sciences] [Google Scholar]
- Fudamoto, Y., Oesch, P. A., Schouws, S., et al. 2021, Nature, 597, 489 [CrossRef] [Google Scholar]
- Galbiati, M., Cantalupo, S., Steidel, C., et al. 2025, A&A, 696, A95 [NASA ADS] [CrossRef] [EDP Sciences] [Google Scholar]
- García-Vergara, C., Hennawi, J. F., Barrientos, L. F., & Rix, H.-W. 2017, ApJ, 848, 7 [CrossRef] [Google Scholar]
- Ginolfi, M., Piconcelli, E., Zappacosta, L., et al. 2022, Nat. Commun., 13, 4574 [NASA ADS] [CrossRef] [Google Scholar]
- Girard, M., Fisher, D. B., Bolatto, A. D., et al. 2021, ApJ, 909, 12 [NASA ADS] [CrossRef] [Google Scholar]
- Harris, K., Farrah, D., Schulz, B., et al. 2016, MNRAS, 457, 4179 [NASA ADS] [CrossRef] [Google Scholar]
- Harris, C. R., Millman, K. J., van der Walt, S. J., et al. 2020, Nature, 585, 357 [NASA ADS] [CrossRef] [Google Scholar]
- Herrera-Camus, R., Tacconi, L., Genzel, R., et al. 2019, ApJ, 871, 37 [NASA ADS] [CrossRef] [Google Scholar]
- Herrera-Camus, R., Janssen, A., Sturm, E., et al. 2020, A&A, 635, A47 [NASA ADS] [CrossRef] [EDP Sciences] [Google Scholar]
- Ho, L. C. 2007, ApJ, 669, 821 [Google Scholar]
- Hodge, J. A., Carilli, C. L., Walter, F., et al. 2012, ApJ, 760, 11 [Google Scholar]
- Hodge, J. A., Smail, I., Walter, F., et al. 2019, ApJ, 876, 130 [Google Scholar]
- Högbom, J. A. 1974, A&AS, 15, 417 [Google Scholar]
- Hopkins, P. F., Kereš, D., Oñorbe, J., et al. 2014, MNRAS, 445, 581 [NASA ADS] [CrossRef] [Google Scholar]
- Hunter, J. D. 2007, Comput. Sci. Eng., 9, 90 [NASA ADS] [CrossRef] [Google Scholar]
- Hunter, T. R., Indebetouw, R., Brogan, C. L., et al. 2023, PASP, 135, 074501 [NASA ADS] [CrossRef] [Google Scholar]
- Iono, D., Yun, M. S., Aretxaga, I., et al. 2016, ApJ, 829, L10 [Google Scholar]
- Iorio, G., Fraternali, F., Nipoti, C., et al. 2017, MNRAS, 466, 4159 [NASA ADS] [Google Scholar]
- Kashino, D., Lilly, S. J., Matthee, J., et al. 2023, ApJ, 950, 66 [CrossRef] [Google Scholar]
- Kohandel, M., Pallottini, A., Ferrara, A., et al. 2019, MNRAS, 487, 3007 [NASA ADS] [CrossRef] [Google Scholar]
- Kohandel, M., Pallottini, A., Ferrara, A., et al. 2024, A&A, 685, A72 [NASA ADS] [CrossRef] [EDP Sciences] [Google Scholar]
- Kouroumpatzakis, K., Zezas, A., Kyritsis, E., Salim, S., & Svoboda, J. 2023, A&A, 673, A16 [NASA ADS] [CrossRef] [EDP Sciences] [Google Scholar]
- Kovács, A., Chapman, S. C., Dowell, C. D., et al. 2006, ApJ, 650, 592 [CrossRef] [Google Scholar]
- Kroupa, P. 2001, MNRAS, 322, 231 [NASA ADS] [CrossRef] [Google Scholar]
- Kulkarni, G., Worseck, G., & Hennawi, J. F. 2019, MNRAS, 488, 1035 [Google Scholar]
- Leipski, C., Meisenheimer, K., Walter, F., et al. 2013, ApJ, 772, 103 [NASA ADS] [CrossRef] [Google Scholar]
- Lelli, F., Verheijen, M., Fraternali, F., & Sancisi, R. 2012a, A&A, 537, A72 [NASA ADS] [CrossRef] [EDP Sciences] [Google Scholar]
- Lelli, F., Verheijen, M., Fraternali, F., & Sancisi, R. 2012b, A&A, 544, A145 [NASA ADS] [CrossRef] [EDP Sciences] [Google Scholar]
- Lelli, F., Di Teodoro, E. M., Fraternali, F., et al. 2021, Science, 371, 713 [Google Scholar]
- Lelli, F., Zhang, Z.-Y., Bisbas, T. G., et al. 2023, A&A, 672, A106 [NASA ADS] [CrossRef] [EDP Sciences] [Google Scholar]
- Madau, P., & Dickinson, M. 2014, ARA&A, 52, 415 [Google Scholar]
- Maloney, P. R., Hollenbach, D. J., & Tielens, A. G. G. M. 1996, ApJ, 466, 561 [Google Scholar]
- Marasco, A., Fraternali, F., Heald, G., et al. 2019, A&A, 631, A50 [NASA ADS] [CrossRef] [EDP Sciences] [Google Scholar]
- Marshall, M. A., Wyithe, J. S. B., Windhorst, R. A., et al. 2021, MNRAS, 506, 1209 [CrossRef] [Google Scholar]
- McMullin, J. P., Waters, B., Schiebel, D., Young, W., & Golap, K. 2007, ASP Conf. Ser., 376, 127 [Google Scholar]
- Meijerink, R., Kristensen, L. E., Weiß, A., et al. 2013, ApJ, 762, L16 [Google Scholar]
- Montoya Arroyave, I., Cicone, C., Makroleivaditi, E., et al. 2023, A&A, 673, A13 [NASA ADS] [CrossRef] [EDP Sciences] [Google Scholar]
- Murphy, E. J., Condon, J. J., Schinnerer, E., et al. 2011, ApJ, 737, 67 [Google Scholar]
- Neeleman, M., Bañados, E., Walter, F., et al. 2019, ApJ, 882, 10 [Google Scholar]
- Neeleman, M., Prochaska, J. X., Kanekar, N., & Rafelski, M. 2020, Nature, 581, 269 [Google Scholar]
- Neeleman, M., Novak, M., Venemans, B. P., et al. 2021, ApJ, 911, 141 [NASA ADS] [CrossRef] [Google Scholar]
- Pacifici, C., Iyer, K. G., Mobasher, B., et al. 2023, ApJ, 944, 141 [NASA ADS] [CrossRef] [Google Scholar]
- Pensabene, A., Carniani, S., Perna, M., et al. 2020, A&A, 637, A84 [NASA ADS] [CrossRef] [EDP Sciences] [Google Scholar]
- Pensabene, A., Decarli, R., Bañados, E., et al. 2021, A&A, 652, A66 [NASA ADS] [CrossRef] [EDP Sciences] [Google Scholar]
- Pensabene, A., Cantalupo, S., Cicone, C., et al. 2024, A&A, 684, A119 [NASA ADS] [CrossRef] [EDP Sciences] [Google Scholar]
- Pitchford, L. K., Hatziminaoglou, E., Feltre, A., et al. 2016, MNRAS, 462, 4067 [NASA ADS] [CrossRef] [Google Scholar]
- Planck Collaboration VI. 2020, A&A, 641, A6 [NASA ADS] [CrossRef] [EDP Sciences] [Google Scholar]
- Polletta, M., Nesvadba, N. P. H., Neri, R., et al. 2011, A&A, 533, A20 [NASA ADS] [CrossRef] [EDP Sciences] [Google Scholar]
- Popesso, P., Concas, A., Cresci, G., et al. 2023, MNRAS, 519, 1526 [Google Scholar]
- Price, S. H., Übler, H., Förster Schreiber, N. M., et al. 2022, A&A, 665, A159 [NASA ADS] [CrossRef] [EDP Sciences] [Google Scholar]
- Ren, B. B., Fogarty, K., Debes, J. H., et al. 2024, A&A, 683, L5 [NASA ADS] [CrossRef] [EDP Sciences] [Google Scholar]
- Richards, G. T., Lacy, M., Storrie-Lombardi, L. J., et al. 2006, ApJS, 166, 470 [Google Scholar]
- Riechers, D. A., Walter, F., Bertoldi, F., et al. 2009, ApJ, 703, 1338 [NASA ADS] [CrossRef] [Google Scholar]
- Rigby, J., Perrin, M., McElwain, M., et al. 2023, PASP, 135, 048001 [NASA ADS] [CrossRef] [Google Scholar]
- Rizzo, F., Vegetti, S., Powell, D., et al. 2020, Nature, 584, 201 [Google Scholar]
- Rizzo, F., Vegetti, S., Fraternali, F., Stacey, H. R., & Powell, D. 2021, MNRAS, 507, 3952 [NASA ADS] [CrossRef] [Google Scholar]
- Rizzo, F., Roman-Oliveira, F., Fraternali, F., et al. 2023, A&A, 679, A129 [NASA ADS] [CrossRef] [EDP Sciences] [Google Scholar]
- Rizzo, F., Bacchini, C., Kohandel, M., et al. 2024, A&A, 689, A273 [NASA ADS] [CrossRef] [EDP Sciences] [Google Scholar]
- Rogstad, D. H., Lockhart, I. A., & Wright, M. C. H. 1974, ApJ, 193, 309 [Google Scholar]
- Roman-Oliveira, F., Fraternali, F., & Rizzo, F. 2023, MNRAS, 521, 1045 [NASA ADS] [CrossRef] [Google Scholar]
- Roman-Oliveira, F., Rizzo, F., & Fraternali, F. 2024, A&A, 687, A35 [NASA ADS] [CrossRef] [EDP Sciences] [Google Scholar]
- Rowland, L. E., Hodge, J., Bouwens, R., et al. 2024, MNRAS, 535, 2068 [Google Scholar]
- Rupke, D. S., Veilleux, S., & Sanders, D. B. 2005, ApJS, 160, 115 [Google Scholar]
- Schaye, J., Crain, R. A., Bower, R. G., et al. 2015, MNRAS, 446, 521 [Google Scholar]
- Schöier, F. L., van der Tak, F. F. S., van Dishoeck, E. F., & Black, J. H. 2005, A&A, 432, 369 [Google Scholar]
- Solomon, P. M., Downes, D., Radford, S. J. E., & Barrett, J. W. 1997, ApJ, 478, 144 [NASA ADS] [CrossRef] [Google Scholar]
- Stone, M. A., Lyu, J., Rieke, G. H., & Alberts, S. 2023, ApJ, 953, 180 [NASA ADS] [CrossRef] [Google Scholar]
- Tacconi, L. J., Genzel, R., Neri, R., et al. 2010, Nature, 463, 781 [Google Scholar]
- Tadaki, K., Iono, D., Yun, M. S., et al. 2018, Nature, 560, 613 [Google Scholar]
- Taylor, E. N., Franx, M., Brinchmann, J., van der Wel, A., & van Dokkum, P. G. 2010, ApJ, 722, 1 [Google Scholar]
- Trakhtenbrot, B., Lira, P., Netzer, H., et al. 2017, ApJ, 836, 8 [NASA ADS] [CrossRef] [Google Scholar]
- Travascio, A., Cantalupo, S., Tozzi, P., et al. 2025, A&A, 694, A165 [NASA ADS] [CrossRef] [EDP Sciences] [Google Scholar]
- Tripodi, R., Feruglio, C., Fiore, F., et al. 2024, A&A, 689, A220 [NASA ADS] [CrossRef] [EDP Sciences] [Google Scholar]
- Tully, R. B., & Fisher, J. R. 1977, A&A, 54, 661 [NASA ADS] [Google Scholar]
- Turner, O. J., Cirasuolo, M., Harrison, C. M., et al. 2017, MNRAS, 471, 1280 [Google Scholar]
- Uchiyama, H., Toshikawa, J., Kashikawa, N., et al. 2018, PASJ, 70, S32 [NASA ADS] [CrossRef] [Google Scholar]
- Umehata, H., Steidel, C. C., Smail, I., et al. 2025, PASJ, 77, 432 [Google Scholar]
- Urrutia, T., Lacy, M., & Becker, R. H. 2008, ApJ, 674, 80 [Google Scholar]
- Vallini, L., Tielens, A. G. G. M., Pallottini, A., et al. 2019, MNRAS, 490, 4502 [CrossRef] [Google Scholar]
- van der Wel, A., van Houdt, J., Bezanson, R., et al. 2022, ApJ, 936, 9 [NASA ADS] [CrossRef] [Google Scholar]
- Vayner, A., Zakamska, N., Wright, S. A., et al. 2021, ApJ, 923, 59 [CrossRef] [Google Scholar]
- Veilleux, S., Meléndez, M., Sturm, E., et al. 2013, ApJ, 776, 27 [Google Scholar]
- Veilleux, S., Bolatto, A., Tombesi, F., et al. 2017, ApJ, 843, 18 [Google Scholar]
- Venemans, B. P., Neeleman, M., Walter, F., et al. 2019, ApJ, 874, L30 [NASA ADS] [CrossRef] [Google Scholar]
- Venkateshwaran, A., Weiss, A., Sulzenauer, N., et al. 2024, ApJ, 977, 161 [Google Scholar]
- Virtanen, P., Gommers, R., Oliphant, T. E., et al. 2020, Nat. Meth., 17, 261 [Google Scholar]
- Vogelsberger, M., Marinacci, F., Torrey, P., & Puchwein, E. 2020, Nat. Rev. Phys., 2, 42 [Google Scholar]
- Volonteri, M., Capelo, P. R., Netzer, H., et al. 2015, MNRAS, 449, 1470 [NASA ADS] [CrossRef] [Google Scholar]
- Walter, F., Carilli, C., Bertoldi, F., et al. 2004, ApJ, 615, L17 [NASA ADS] [CrossRef] [Google Scholar]
- Wang, R., Wagg, J., Carilli, C. L., et al. 2013, ApJ, 773, 44 [Google Scholar]
- Wang, W., Cantalupo, S., Pensabene, A., et al. 2025, Nat. Astron., 9, 710 [Google Scholar]
- Weiß, A., Neininger, N., Hüttemeister, S., & Klein, U. 2001, A&A, 365, 571 [NASA ADS] [CrossRef] [EDP Sciences] [Google Scholar]
- Willott, C. J., Bergeron, J., & Omont, A. 2015, ApJ, 801, 123 [NASA ADS] [CrossRef] [Google Scholar]
- Wisnioski, E., Förster Schreiber, N. M., Fossati, M., et al. 2019, ApJ, 886, 124 [Google Scholar]
- Xiao, M. Y., Elbaz, D., Gómez-Guijarro, C., et al. 2023, A&A, 672, A18 [NASA ADS] [CrossRef] [EDP Sciences] [Google Scholar]
- Zakamska, N. L., Hamann, F., Pâris, I., et al. 2016, MNRAS, 459, 3144 [NASA ADS] [CrossRef] [Google Scholar]
- Zhang, Z.-Y., Papadopoulos, P. P., Ivison, R. J., et al. 2016, Roy. Soc. Open Sci., 3, 160025 [NASA ADS] [CrossRef] [Google Scholar]
Appendix A: Geometrical parameters of the MQN01-QC galaxy disk derived with CANNUBI
Figure A.1 show the posterior probability distributions for the free parameter of the MQN01-QC disk geometry obtained with CANNUBI (see Sect. 4). These include the disk inclination angle, the coordinates of the center, the position angle (pa), and the radial separation between the annuli.
 |
Fig. A.1. Posterior probability distribution for the MQN01-QC geometrical parameters as obtained with CANNUBI. These include the disk inclination angle (incl) in degrees, the disk center (x0, y0) in pixels (where 1 pix corresponds to |

Appendix B: Channel maps of the quasar host–MQN01-QC galaxy system
Figure B.1 shows the channel maps of the CO(4−3) line datacube of the quasar host and the MQN01-QC galaxy. We also overlay the corresponding best-fit rotating disk model of the MQN01-QC galaxy as obtained with 3DBAROLO.
 |
Fig. B.1. Channel maps of the quasar host–MQN01-QC system extracted from the continuum-subtracted ALMA band 3 datacube. Each panel was obtained by averaging channels in the datacube within 100 km s−1-wide windows, as reported at the top of each panel. The original datacube used for the kinematical modeling has a channel width of 25 km s−1. The maps are color-coded based on the signal-to-noise ratio. The gray contours show −2 × S/N (dotted), and 2n × S/N (solid) isophotes, where n ≥ 1 is an integer number. The green contours show the best-fit rotating disk model as obtained with 3DBAROLO. |
All Tables
Line and continuum flux measurements, luminosity estimates, and derived quantities of the sources.
Mass budgets, dust characteristics, and morphological sizes of the quasar host and the MQN01-QC galaxy.
All Figures
|
Fig. 1. Images of the MQN01-QC galaxy located ∼10 kpc south of the hyper-luminous QSO CTS G18.01 at z ≈ 3.2. Left panel: JWST/NIRCam F322W2 snapshot (Wang et al. 2025). Central panel: Same as the left panel but with two rounds of quasar light removal (QSO − PSF). The result, shown in the lower-right half of the image below the dotted demarcation line provides a remarkably clearer view of the galaxy (indicated by the circle) compared to the original image on the left. Details about the light removal and stellar mass estimation are described in Sects. 2.4 and 3.4, respectively. Similar steps were conducted to the NIRCam F150W2 filter image. Right panel: ALMA 3 mm dust continuum image. The dashed gray lines indicate the nominal location of the sources as derived from the peak of the dust continuum. The dotted and solid contours in the ALMA map correspond to −2σ and [3, 2n]σ, respectively, where n > 1 is an integer, and σ denotes the noise RMS. The ALMA synthesized beam is shown as a yellow ellipse in the bottom right corner. |
| In the text | |
|
Fig. 2. Continuum-subtracted CO(4−3) and CO(9−8) line of the QSO CTS G18.01 host galaxy (top and bottom panel) and the CO(4−3) line of the MQN01-QC (central panel). The data are reported in yellow. The black solid line shows the best-fit model. The gray shaded area shows the 1σ confidence interval of the best-fit model. The individual Gaussian components are reported in red and blue for the quasar line profile. The green solid line in the central panel shows the line profile extracted from the best-fit rotating disk model as obtained with 3DBAROLO (see Sect. 4). The fit residuals (data − model) are also reported below each spectra, where the shaded area represents the noise RMS. The bottom velocity scale refers to the quasar systemic redshift as determined by the red component of the quasar CO(4−3) line profile. |
| In the text | |
|
Fig. 3. CO(4−3) line-velocity integrated map (moment 0, left panel), line-of-sight velocity field (Vlos, moment 1, central panel), and line-of-sight velocity dispersion field (σlos, moment 2, right panel) of the quasar host–MQN01-QC galaxy system. These maps are obtained from the continuum-subtracted ALMA datacube using channels within [ − 700; +400] km s−1 around the quasar systemic redshift (Vlos = 0). The dotted (negative) and solid (positive) contours correspond to [ − 2, 3, 2n]σ, where n ≥ 2 is an integer, and σ denotes the noise RMS. The white crosses mark the peak emission of the 3 mm dust continuum. The 3σ contour of the 0th moment is also reported in the moment 1st and 2nd maps. The ALMA synthesized beam is shown in the bottom right corner. |
| In the text | |
|
Fig. 4. Dust SED modeling of the quasar host (red circles) and the MQN01-QC galaxy (blue diamonds). The solid and dashed lines show the best-fit modified blackbody models for different assumptions on the dust temperature. The 1σ confidence intervals on the best fit are reported with shaded areas. The inset corner plot shows the posterior probability distributions of the free parameters for the quasar host (red) for Tdust = 45 K and the MQN01-QC (blue) for Tdust = 35 K. |
| In the text | |
|
Fig. 5. Geometrical and kinematical modeling results as obtained with CANNUBI and 3DBAROLO. Left panel: Observed CO(4−3) line-velocity integrated map overlaid with the best-fit model. The black and red contours show the [4, 16]σ isophotes of the data and the model, respectively, where σ denotes the noise RMS in the flux map. The dashed gray lines indicate the best-fit location of the major and minor axes of the disk. The white circles show the spacing between the model rings. The ALMA synthesized beam is reported in the bottom right corner. Central and right panels: Position-velocity diagrams along the best-fit major and minor axis of the model. The black and red contours show the [2, 4]σ isophotes of the data and the best-fit rotating thin-disk model, respectively, where σ is the noise RMS per velocity channel. |
| In the text | |
|
Fig. 6. Redshift distribution of the mean velocity dispersion (left panel) and the degree of rotational support (right panel) for a sample of main-sequence and starburst galaxy disks. Data points are taken from Rizzo et al. (2020, 2021, 2023, 2024), Fraternali et al. (2021), Girard et al. (2021), and Roman-Oliveira et al. (2023), who analyzed galaxy cold gas kinematics traced by CO emission lines. The |
| In the text | |
|
Fig. 7. Velocity curves of z ≳ 1.5 main-sequence and starburst galaxy disks from Rizzo et al. (2020, 2021), Fraternali et al. (2021), Lelli et al. (2023), Roman-Oliveira et al. (2023) and those of giant spiral galaxies discovered in z ∼ 3 protoclusters (ADF22.A1, Umehata et al. 2025, and Big Wheel, Wang et al. 2025). The MQN01-QC velocity curve as derived in this work is indicated by the blue diamond. |
| In the text | |
|
Fig. 8. Search for gas emission around galaxies. Top panel: Line emission components of the system. Background image and gray contours represent the total CO(4−3) and CO(9−8) intensity map, respectively. These are obtained within ΔvQSO = [ − 700; +400] km s−1. The red and blue contours on the quasar host galaxy show residual line maps after subtracting from the CO(4−3) total flux map, the blueshifted [ − 900, −300] km s−1, and the systemic [ − 300, +400] km s−1 image component, respectively. The contours correspond to [3, 2n]σ, with n > 1 is an integer number, and σ denotes the noise RMS. The contours on the MQN01-QC shows instead the isovelocity curves (blue: [ − 500, −350] km s−1; white: [ − 300, −150] km s−1; red: [ − 100, 50] km s−1). The synthesized beam of the band 6 and 3 observations are reported with the gray hatched and filled ellipse at the bottom right corner, respectively. Bottom panel: PVD extracted along the black ( |
| In the text | |
|
Fig. A.1. Posterior probability distribution for the MQN01-QC geometrical parameters as obtained with CANNUBI. These include the disk inclination angle (incl) in degrees, the disk center (x0, y0) in pixels (where 1 pix corresponds to |
| In the text | |
|
Fig. B.1. Channel maps of the quasar host–MQN01-QC system extracted from the continuum-subtracted ALMA band 3 datacube. Each panel was obtained by averaging channels in the datacube within 100 km s−1-wide windows, as reported at the top of each panel. The original datacube used for the kinematical modeling has a channel width of 25 km s−1. The maps are color-coded based on the signal-to-noise ratio. The gray contours show −2 × S/N (dotted), and 2n × S/N (solid) isophotes, where n ≥ 1 is an integer number. The green contours show the best-fit rotating disk model as obtained with 3DBAROLO. |
| In the text | |
Current usage metrics show cumulative count of Article Views (full-text article views including HTML views, PDF and ePub downloads, according to the available data) and Abstracts Views on Vision4Press platform.
Data correspond to usage on the plateform after 2015. The current usage metrics is available 48-96 hours after online publication and is updated daily on week days.
Initial download of the metrics may take a while.