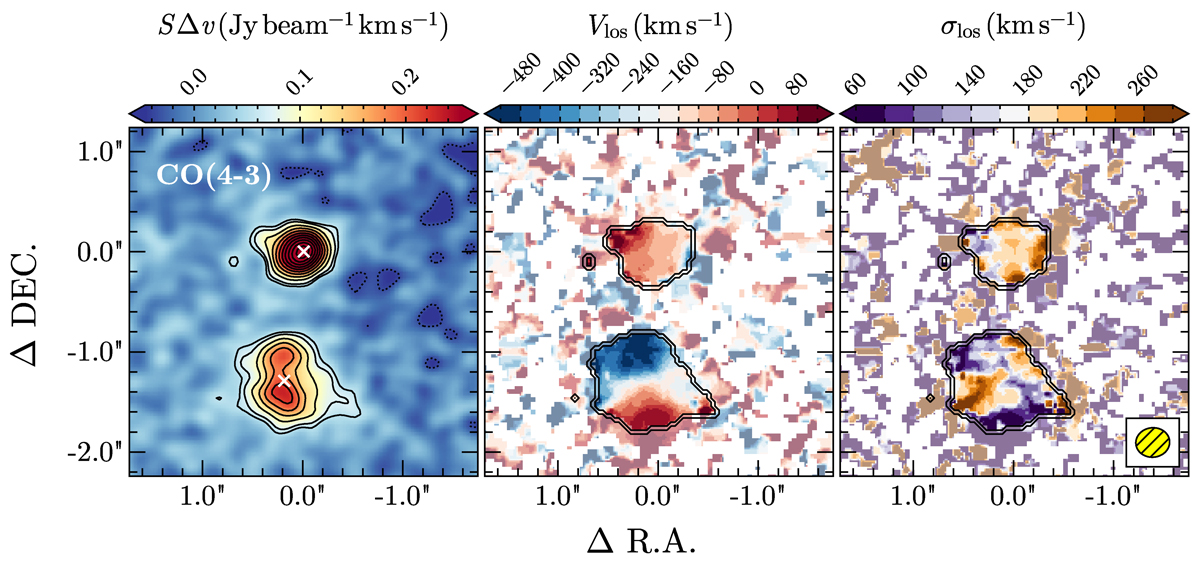
Fig. 3.
Download original image
CO(4−3) line-velocity integrated map (moment 0, left panel), line-of-sight velocity field (Vlos, moment 1, central panel), and line-of-sight velocity dispersion field (σlos, moment 2, right panel) of the quasar host–MQN01-QC galaxy system. These maps are obtained from the continuum-subtracted ALMA datacube using channels within [ − 700; +400] km s−1 around the quasar systemic redshift (Vlos = 0). The dotted (negative) and solid (positive) contours correspond to [ − 2, 3, 2n]σ, where n ≥ 2 is an integer, and σ denotes the noise RMS. The white crosses mark the peak emission of the 3 mm dust continuum. The 3σ contour of the 0th moment is also reported in the moment 1st and 2nd maps. The ALMA synthesized beam is shown in the bottom right corner.
Current usage metrics show cumulative count of Article Views (full-text article views including HTML views, PDF and ePub downloads, according to the available data) and Abstracts Views on Vision4Press platform.
Data correspond to usage on the plateform after 2015. The current usage metrics is available 48-96 hours after online publication and is updated daily on week days.
Initial download of the metrics may take a while.