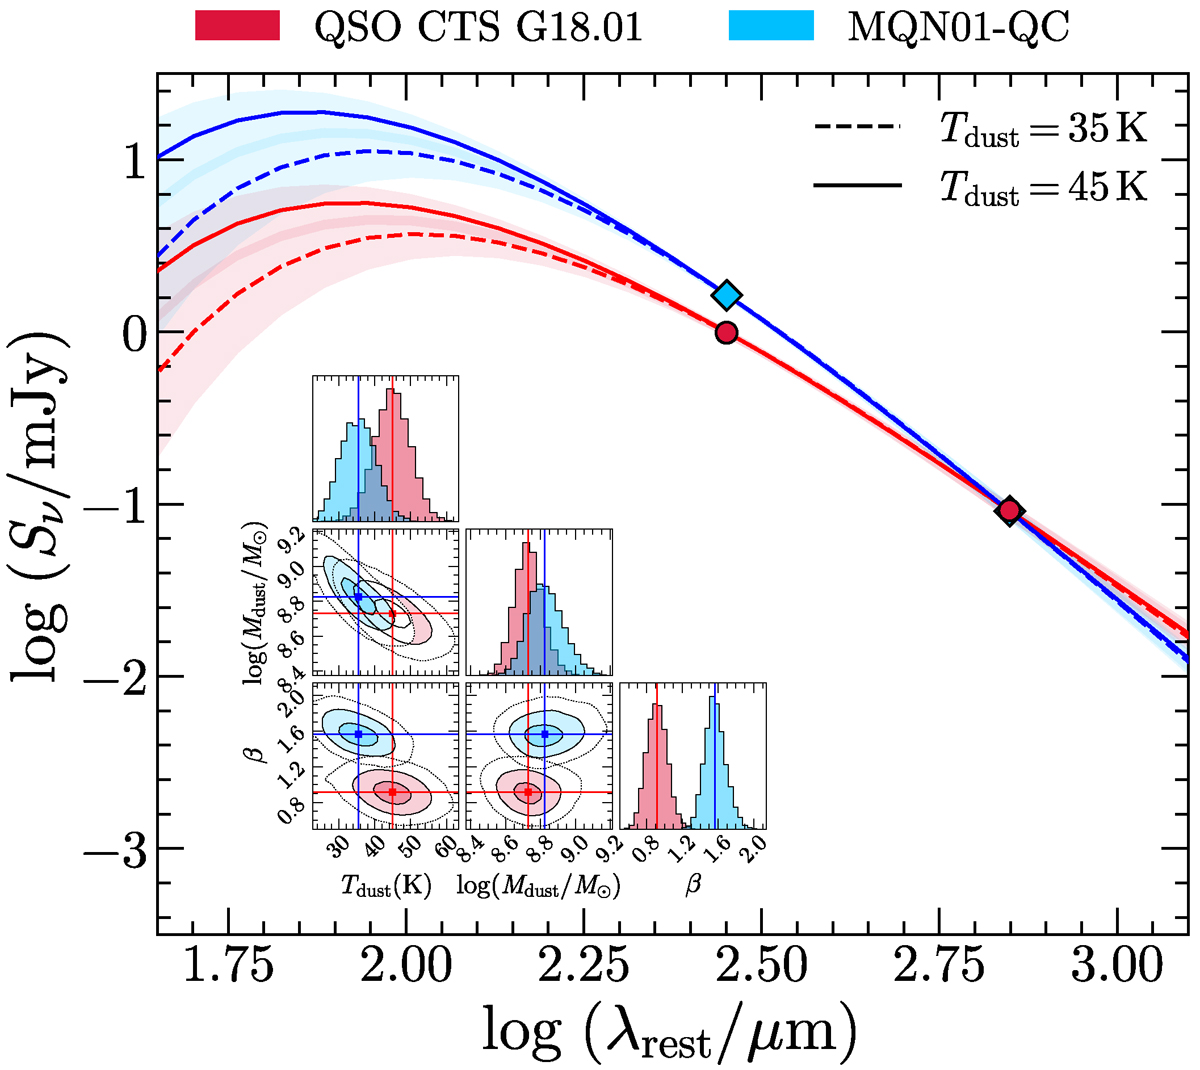
Fig. 4.
Download original image
Dust SED modeling of the quasar host (red circles) and the MQN01-QC galaxy (blue diamonds). The solid and dashed lines show the best-fit modified blackbody models for different assumptions on the dust temperature. The 1σ confidence intervals on the best fit are reported with shaded areas. The inset corner plot shows the posterior probability distributions of the free parameters for the quasar host (red) for Tdust = 45 K and the MQN01-QC (blue) for Tdust = 35 K.
Current usage metrics show cumulative count of Article Views (full-text article views including HTML views, PDF and ePub downloads, according to the available data) and Abstracts Views on Vision4Press platform.
Data correspond to usage on the plateform after 2015. The current usage metrics is available 48-96 hours after online publication and is updated daily on week days.
Initial download of the metrics may take a while.