Fig. 5.
Download original image
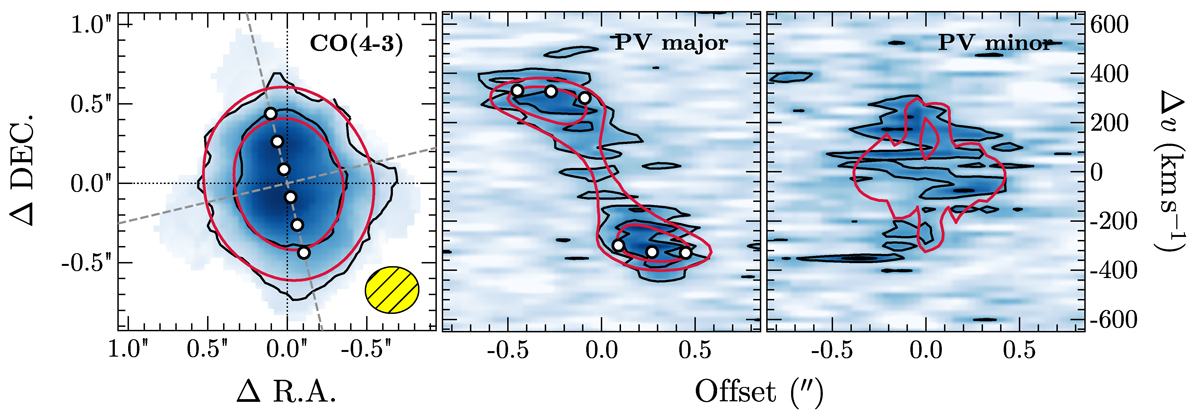
Geometrical and kinematical modeling results as obtained with CANNUBI and 3DBAROLO. Left panel: Observed CO(4−3) line-velocity integrated map overlaid with the best-fit model. The black and red contours show the [4, 16]σ isophotes of the data and the model, respectively, where σ denotes the noise RMS in the flux map. The dashed gray lines indicate the best-fit location of the major and minor axes of the disk. The white circles show the spacing between the model rings. The ALMA synthesized beam is reported in the bottom right corner. Central and right panels: Position-velocity diagrams along the best-fit major and minor axis of the model. The black and red contours show the [2, 4]σ isophotes of the data and the best-fit rotating thin-disk model, respectively, where σ is the noise RMS per velocity channel.
Current usage metrics show cumulative count of Article Views (full-text article views including HTML views, PDF and ePub downloads, according to the available data) and Abstracts Views on Vision4Press platform.
Data correspond to usage on the plateform after 2015. The current usage metrics is available 48-96 hours after online publication and is updated daily on week days.
Initial download of the metrics may take a while.