Fig. 6.
Download original image
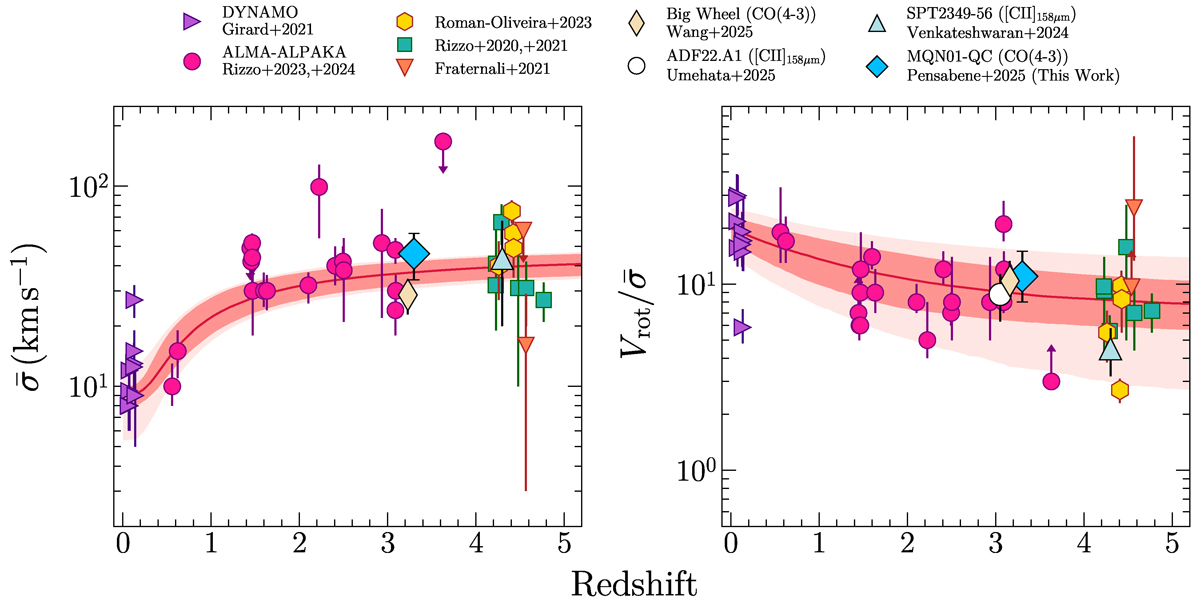
Redshift distribution of the mean velocity dispersion (left panel) and the degree of rotational support (right panel) for a sample of main-sequence and starburst galaxy disks. Data points are taken from Rizzo et al. (2020, 2021, 2023, 2024), Fraternali et al. (2021), Girard et al. (2021), and Roman-Oliveira et al. (2023), who analyzed galaxy cold gas kinematics traced by CO emission lines. The ![]() values for giant spiral galaxies in MQN01 and SSA22 protocluster from Wang et al. (2025) (CO(4−3)), Umehata et al. (2025) ([CII]158 μm) are also reported by the beige diamond and the white circle, respectively, and slightly shifted horizontally for clarity. The mean velocity dispersion and rotational support of galaxies in SPT 2349−56 protocluster core as traced by the [CII]158 μm line emission are also reported with the light blue triangle (Venkateshwaran et al. 2024). Our measurements for the MQN01-QC galaxy are indicated by the blue diamonds. The red solid line is the best fit model derived in Rizzo et al. (2024). The dark and light shaded areas represent the 1-σ confidence interval on the best-fit relation and its intrinsic scatter, respectively.
values for giant spiral galaxies in MQN01 and SSA22 protocluster from Wang et al. (2025) (CO(4−3)), Umehata et al. (2025) ([CII]158 μm) are also reported by the beige diamond and the white circle, respectively, and slightly shifted horizontally for clarity. The mean velocity dispersion and rotational support of galaxies in SPT 2349−56 protocluster core as traced by the [CII]158 μm line emission are also reported with the light blue triangle (Venkateshwaran et al. 2024). Our measurements for the MQN01-QC galaxy are indicated by the blue diamonds. The red solid line is the best fit model derived in Rizzo et al. (2024). The dark and light shaded areas represent the 1-σ confidence interval on the best-fit relation and its intrinsic scatter, respectively.
Current usage metrics show cumulative count of Article Views (full-text article views including HTML views, PDF and ePub downloads, according to the available data) and Abstracts Views on Vision4Press platform.
Data correspond to usage on the plateform after 2015. The current usage metrics is available 48-96 hours after online publication and is updated daily on week days.
Initial download of the metrics may take a while.