Fig. 8.
Download original image
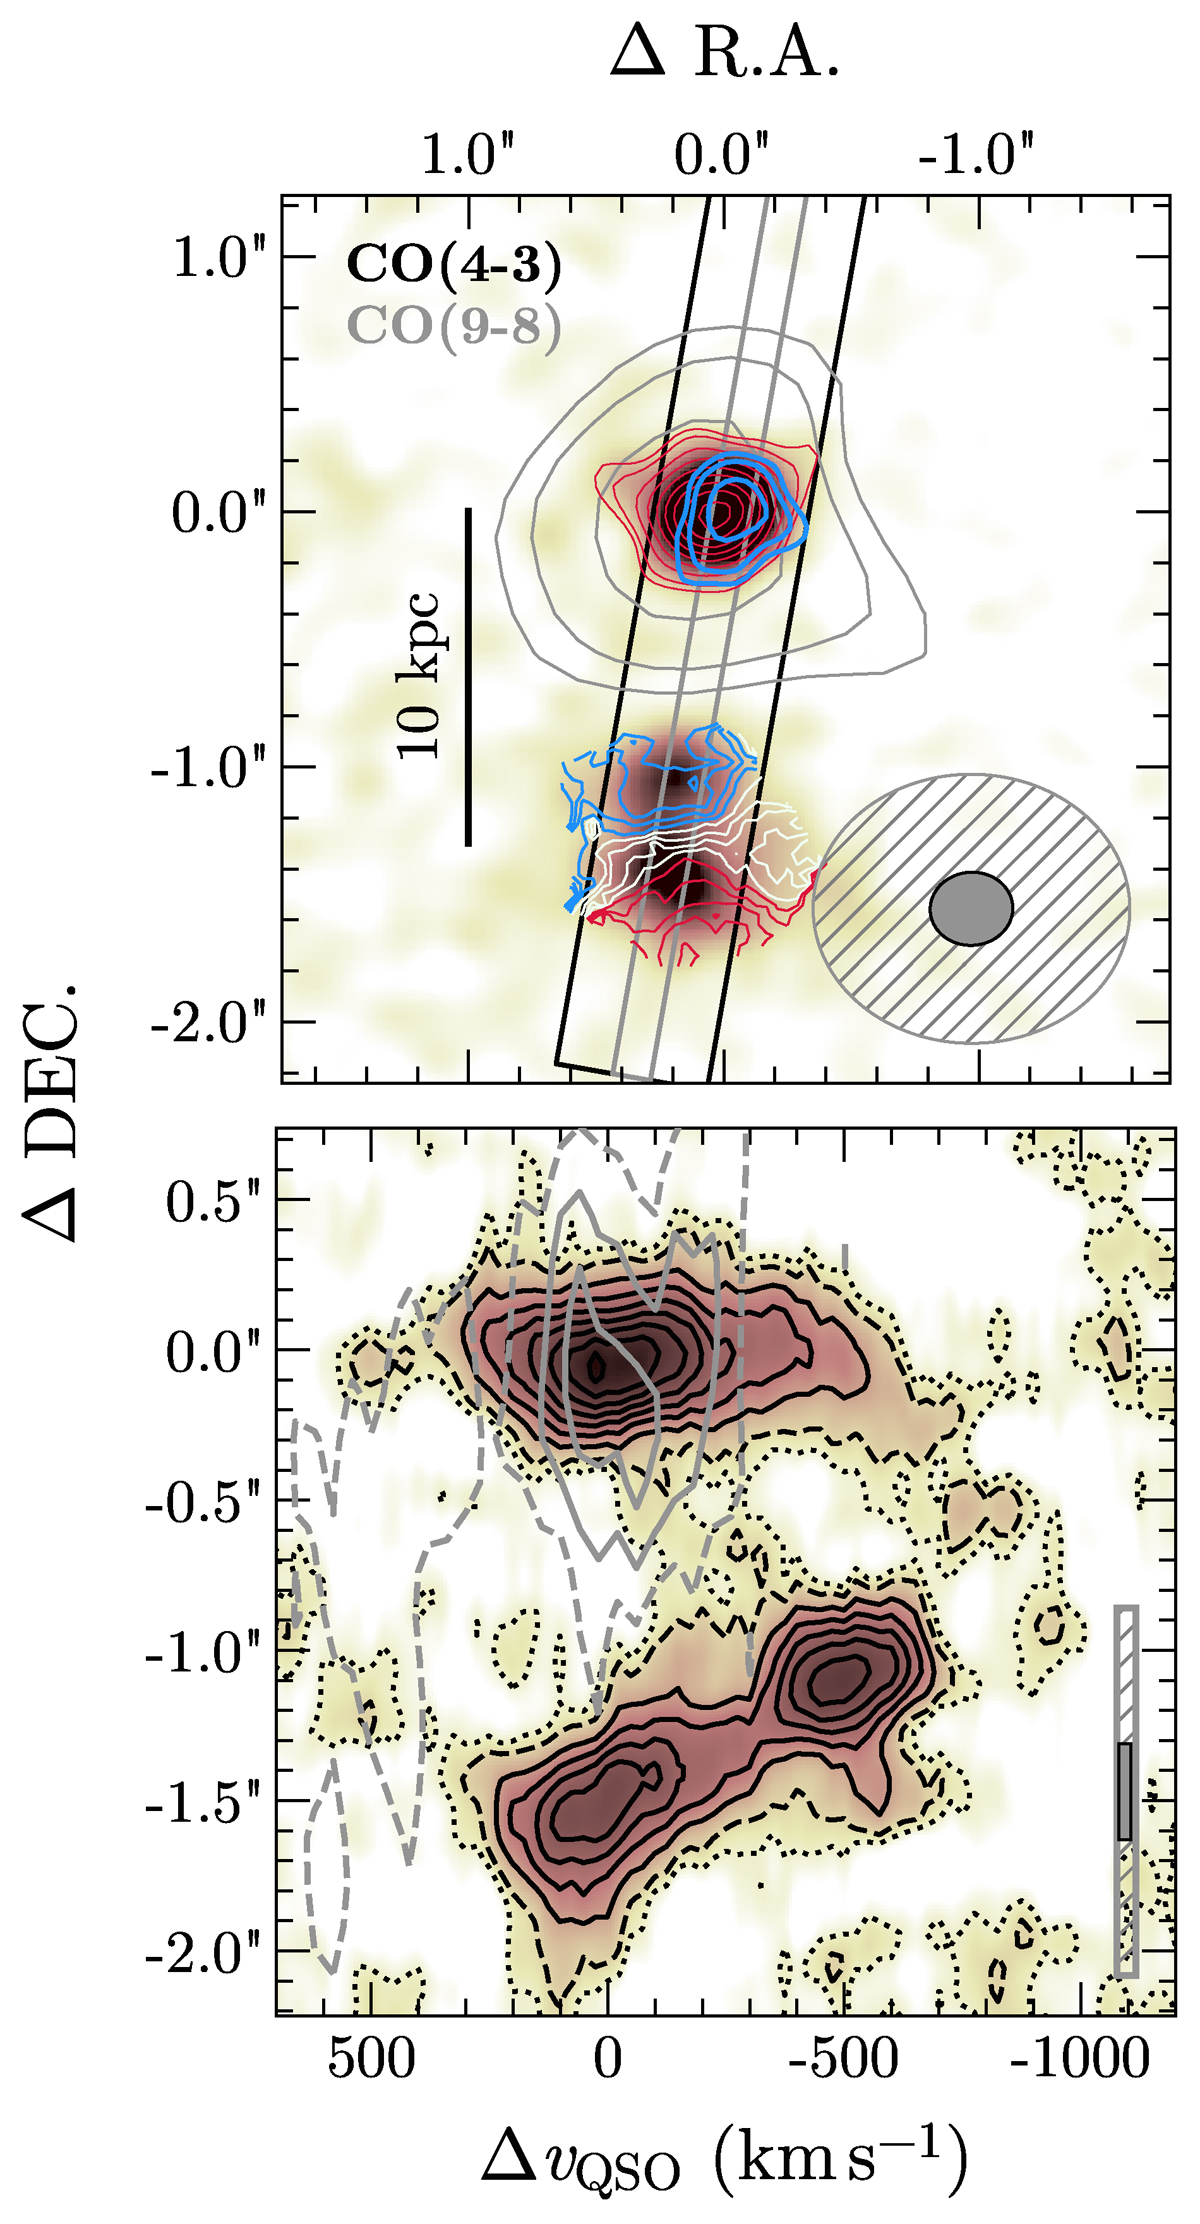
Search for gas emission around galaxies. Top panel: Line emission components of the system. Background image and gray contours represent the total CO(4−3) and CO(9−8) intensity map, respectively. These are obtained within ΔvQSO = [ − 700; +400] km s−1. The red and blue contours on the quasar host galaxy show residual line maps after subtracting from the CO(4−3) total flux map, the blueshifted [ − 900, −300] km s−1, and the systemic [ − 300, +400] km s−1 image component, respectively. The contours correspond to [3, 2n]σ, with n > 1 is an integer number, and σ denotes the noise RMS. The contours on the MQN01-QC shows instead the isovelocity curves (blue: [ − 500, −350] km s−1; white: [ − 300, −150] km s−1; red: [ − 100, 50] km s−1). The synthesized beam of the band 6 and 3 observations are reported with the gray hatched and filled ellipse at the bottom right corner, respectively. Bottom panel: PVD extracted along the black (![]() -wide), and the gray (
-wide), and the gray (![]() -wide) slit, for the band 3 and 6 datacube, respectively (see top panel). The background image and the gray contours report the continuum-subtracted band 3 and 6 data, respectively. The resolution of the each dataset is show with rectangles at the bottom right corner. The dotted dashed and solid contours represent 1σ, 2σ and 2nσ level, respectively.
-wide) slit, for the band 3 and 6 datacube, respectively (see top panel). The background image and the gray contours report the continuum-subtracted band 3 and 6 data, respectively. The resolution of the each dataset is show with rectangles at the bottom right corner. The dotted dashed and solid contours represent 1σ, 2σ and 2nσ level, respectively.
Current usage metrics show cumulative count of Article Views (full-text article views including HTML views, PDF and ePub downloads, according to the available data) and Abstracts Views on Vision4Press platform.
Data correspond to usage on the plateform after 2015. The current usage metrics is available 48-96 hours after online publication and is updated daily on week days.
Initial download of the metrics may take a while.