Open Access
Fig. 1
Download original image
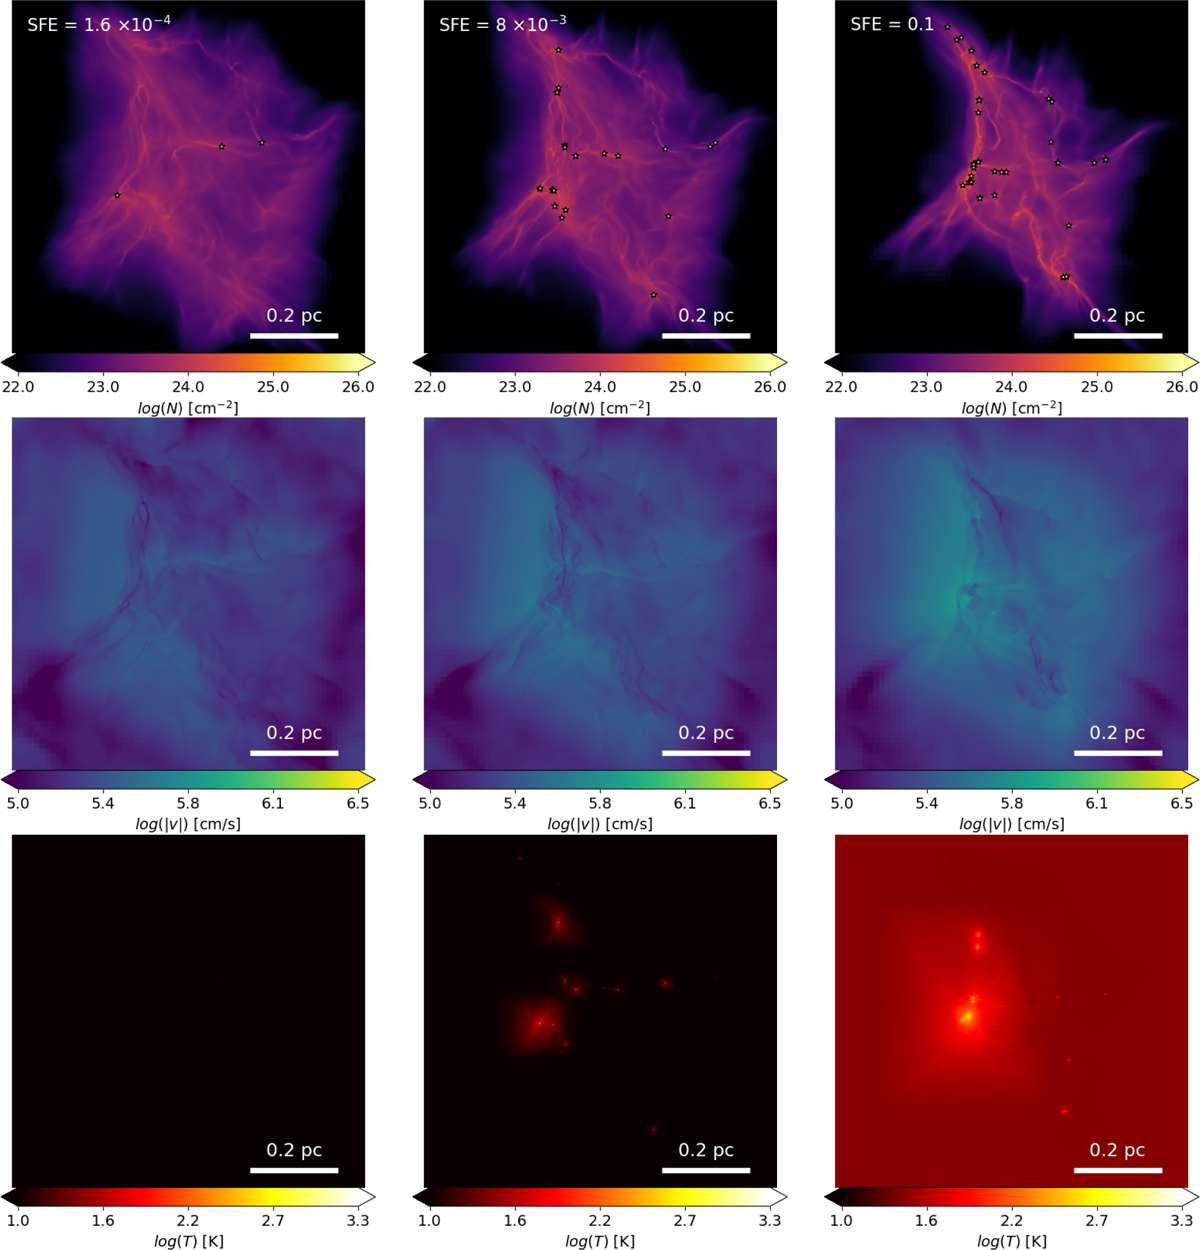
Integrated maps for the reference model in the z direction. From left to right, we display the models at SFE = 1.6 × 10⁻⁴, SFE = 8 × 10⁻³, and SFE=0.1. From top to bottom, we show the column density, mass-averaged velocity, and mass-averaged temperature. The open stars in the top panel indicate the projected sink location.
Current usage metrics show cumulative count of Article Views (full-text article views including HTML views, PDF and ePub downloads, according to the available data) and Abstracts Views on Vision4Press platform.
Data correspond to usage on the plateform after 2015. The current usage metrics is available 48-96 hours after online publication and is updated daily on week days.
Initial download of the metrics may take a while.