Fig. 15
Download original image
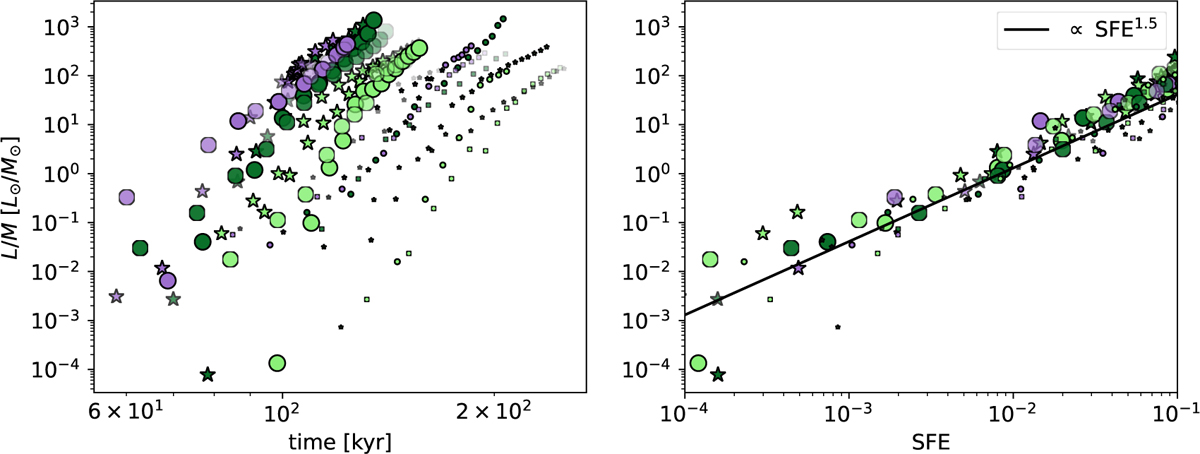
L/M as a function of the time (left) and the SFE (right) for the full RS1.0 catalog of models. Here large (resp. small) markers represent 1000 (resp. 500) M⊙ clumps. We use three different colors to represent the different mass-to-flux ratios (purple is 100, dark green is 10, and light green is 3). In addition, the circles represent seed 1, while the star symbols represent seed 2. Finally, we use the transparency of the markers to display the two Mach numbers (plain markers for Mach 7 and transparent markers for Mach 10).
Current usage metrics show cumulative count of Article Views (full-text article views including HTML views, PDF and ePub downloads, according to the available data) and Abstracts Views on Vision4Press platform.
Data correspond to usage on the plateform after 2015. The current usage metrics is available 48-96 hours after online publication and is updated daily on week days.
Initial download of the metrics may take a while.