Fig. 2
Download original image
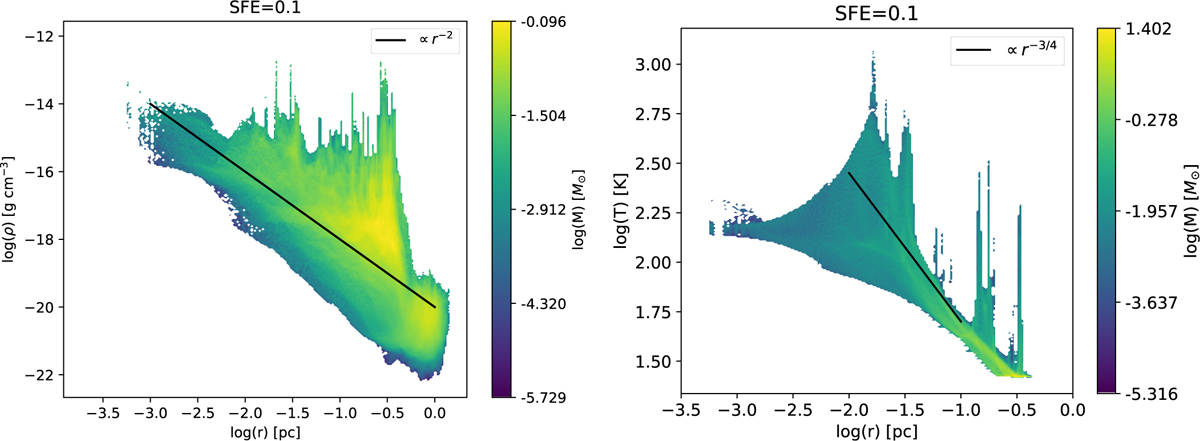
Distribution of physical properties in the reference model. Left: histogram of the density and radius (centered around the density peak). We overlay a r−2 profile, which is expected in a globally collapsing clump. Right: histogram of the temperature as a function of the radius (centered around the density peak). The r−3/4 profile, shown in black, indicates the trend for a star-forming clump at radiative equilibrium for which the temperature is controlled by the stellar luminosity. For both plots, the color map displays the mass in each histogram bin.
Current usage metrics show cumulative count of Article Views (full-text article views including HTML views, PDF and ePub downloads, according to the available data) and Abstracts Views on Vision4Press platform.
Data correspond to usage on the plateform after 2015. The current usage metrics is available 48-96 hours after online publication and is updated daily on week days.
Initial download of the metrics may take a while.