Fig. 3
Download original image
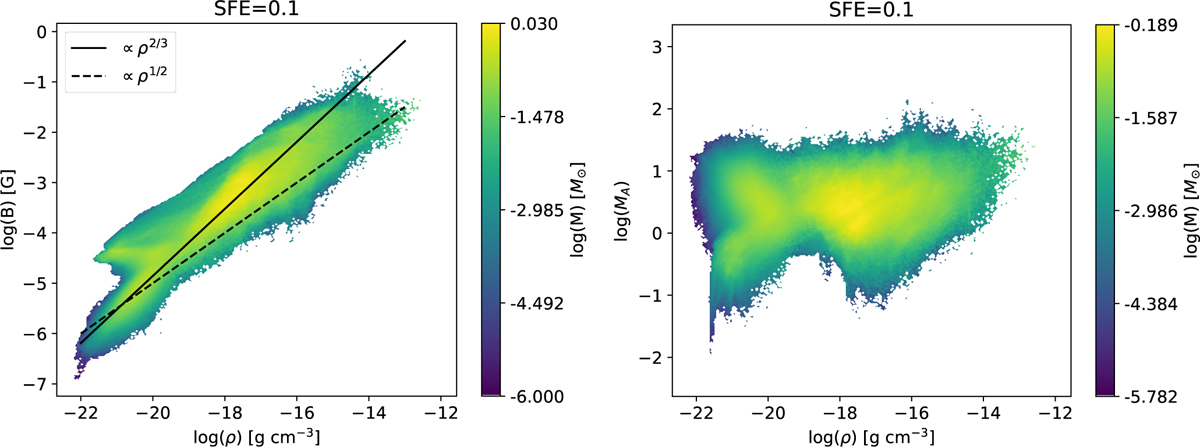
Magnetic field in the reference model. On the left we display the histogram of the magnetic field strength as a function the density. On the right we display the histogram of the Alfvénic Mach number vs. the density. The colors display the mass in each bin of the histogram. The solid and dashed black lines denote a ∝ρ3/2 and ∝ √ρ profile, respectively. The histograms are consistent with a clump for which the bulk of the collapse is weakly influenced by the magnetic field (∝ρ3/2) and some of the low-density material (with MA < 1) is supported, in part, by the magnetic field.
Current usage metrics show cumulative count of Article Views (full-text article views including HTML views, PDF and ePub downloads, according to the available data) and Abstracts Views on Vision4Press platform.
Data correspond to usage on the plateform after 2015. The current usage metrics is available 48-96 hours after online publication and is updated daily on week days.
Initial download of the metrics may take a while.