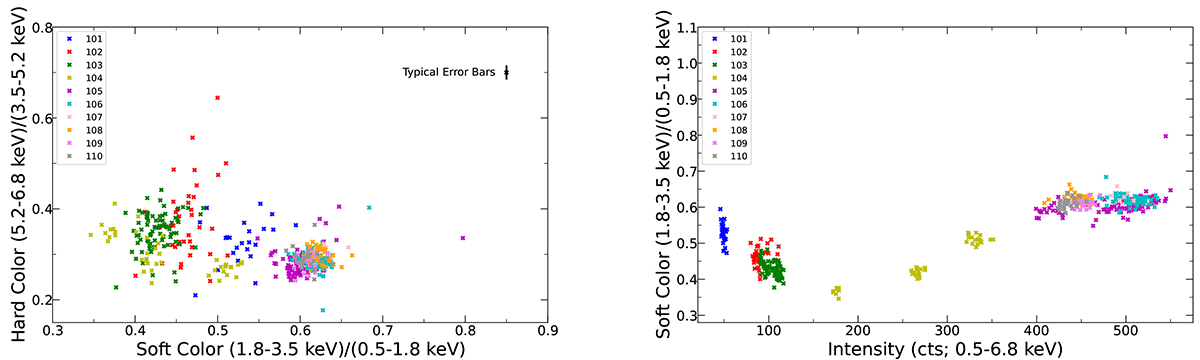
Fig. 2.
Download original image
CCD (left) and HID (right) of the persistent emission of the 2024 outburst observed by NICER. Different colors correspond to different observations, and each point represents a 32-second data segment. Soft color is defined as the ratio of the count rates in the 1.8−3.5 keV band to those in the 0.5−1.8 keV band, while hard color is defined as the ratio of the count rates in the 5.2−6.8 keV band to those in the 3.5−5.2 keV band. The energy band selections for the CCD and HID are consistent with those in Ng et al. (2024).
Current usage metrics show cumulative count of Article Views (full-text article views including HTML views, PDF and ePub downloads, according to the available data) and Abstracts Views on Vision4Press platform.
Data correspond to usage on the plateform after 2015. The current usage metrics is available 48-96 hours after online publication and is updated daily on week days.
Initial download of the metrics may take a while.