| Issue |
A&A
Volume 701, September 2025
|
|
|---|---|---|
| Article Number | A57 | |
| Number of page(s) | 10 | |
| Section | Astrophysical processes | |
| DOI | https://doi.org/10.1051/0004-6361/202554779 | |
| Published online | 03 September 2025 | |
The 2024 outburst of 1A 1744–361 observed by NICER and Insight-HXMT: Type-I X-ray burst and persistent emission
1
Institut für Astronomie und Astrophysik, Kepler Center for Astro and Particle Physics, Eberhard Karls Universität, Tübingen 72076, Germany
2
Key Laboratory of Particle Astrophysics, Institute of High Energy Physics, Chinese Academy of Sciences, Beijing 100049, PR China
3
School of Physics and Astronomy, Sun Yat-Sen University, Zhuhai 519082, PR China
4
National Astronomical Observatories, Chinese Academy of Sciences, Beijing 100101, PR China
5
School of Physics and Optoelectronic Engineering, Shandong University of Technology Zibo 255000, PR China
⋆ Corresponding authors: This email address is being protected from spambots. You need JavaScript enabled to view it.
, This email address is being protected from spambots. You need JavaScript enabled to view it.
Received:
26
March
2025
Accepted:
22
July
2025
Abstract
We present a detailed report on the 2024 outburst observations of 1A 1744−361, including the evolution of persistent emission and a type-I X-ray burst. Observations covered the rising phase of the outburst, a phase rarely reported in previous studies of this source. During the island state in the rising phase, we detected a ∼1 Hz quasiperiodic oscillation (QPO) phenomenon characteristic of dipping sources. The QPO frequency evolved from 0.98 Hz to 2.18 Hz as the outburst flux increased, and the QPO disappeared after the source transitioned into the banana state. Based on the spectral and timing analysis, we suggest that the ∼1 Hz QPO arose from the periodic occultation of the central emission by inner disk structures undergoing Lense-Thirring precession. The ∼1 Hz QPO was also detected during the type-I X-ray burst, with an rms amplitude of 10.53%, a level similar to that observed in the persistent emission. Furthermore, spectral measurements of the type-I X-ray burst indicate a relatively small blackbody radiation radius compared to a typical neutron star radius, which may suggest that type-I X-ray bursts associated with the ∼1 Hz QPO originate from a smaller emission area and exhibit a reduced vertical extent.
Key words: binaries: general
© The Authors 2025
 Open Access article, published by EDP Sciences, under the terms of the Creative Commons Attribution License (https://creativecommons.org/licenses/by/4.0), which permits unrestricted use, distribution, and reproduction in any medium, provided the original work is properly cited.
This article is published in open access under the Subscribe to Open model. This email address is being protected from spambots. You need JavaScript enabled to view it. to support open access publication.
1. Introduction
Neutron star (NS) low-mass X-ray binaries (LMXBs) are X-ray binary systems consisting of a NS as the compact object and a low-mass star as the companion (Lewin & van der Klis 2006). These sources are generally categorized into Z sources and Atoll sources based on their evolutionary tracks in the color-color diagram (CCD). Z sources exhibit Z-shaped tracks in the CCD, while Atoll sources display behaviors resembling a “C” shape. Details regarding the classification and characteristics of these two types can be found in Hasinger & van der Klis (1989). Atoll sources are usually fainter than Z sources, with luminosities typically below 0.5 LEdd (Eddington luminosity). Their spectral states in the CCD can roughly be divided into the “island” and “banana” states. The island state corresponds to the upper part of the C-shaped evolutionary track in the CCD and is somewhat analogous to the hard state in black hole binaries. The spectral components are dominated by Comptonized hard components, but they are more complex than those of black hole binaries, as the seed photons can originate not only from the disk but also from the NS’s surface (Barret 2001; Gierliński & Done 2002; Chen et al. 2023). During the banana state of NS LMXBs, also referred to as the soft state, the low-energy soft component grows significantly. The spectrum is characterized by a combination of a soft component and a weakly Comptonized hard component (Mitsuda et al. 1989; White et al. 1988; Lin et al. 2007). The different spectral states of Atoll sources are also associated with varying timing properties (van der Klis 2004). The root mean square (rms) amplitude in the power density spectrum (PDS) gradually decreases as the spectral state softens, transitioning from Lorentzian-dominated shapes to power-law-dominated ones (Hasinger & van der Klis 1989). Additionally, quasiperiodic oscillation (QPO) components can be detected in the PDS, varying from millihertz to kilohertz frequencies (Motta et al. 2017). The ∼1 Hz QPO in particular is frequently observed in dipping or eclipsing NS LMXBs, and it seems to occur only in the island state (Homan 2012; Homan et al. 2015).
In NS LMXBs, in addition to persistent radiation, there are often short-duration episodes (on the order of seconds) of dramatic increases in count rates. This phenomenon is identified as type-I X-ray bursts, also known as thermonuclear bursts (Galloway et al. 2008). These bursts originate from the unstable thermonuclear burning of material accumulated on the NS’s surface. When hydrogen or helium accreted from the companion star accumulates to a thickness of several meters on the NS’s surface, the pressure and temperature conditions can reach the threshold for unstable nuclear burning, thereby triggering a type-I X-ray burst (Galloway & Keek 2021). Type-I X-ray bursts typically exhibit a fast-rise and exponential-decay count rate profile. Once a burst is triggered, the burning propagates across the entire NS surface within a few seconds. The observed spectrum generally resembles blackbody radiation, though it may deviate slightly from a pure blackbody due to interactions between the burst and the accretion flow (Chen et al. 2010; Worpel et al. 2013; Ji et al. 2014).
The LMXB 1A 1744−361 was first discovered in 1976 by the Ariel V satellite during an outburst (Carpenter et al. 1977). In August 1989, the source was observed by the COded-Mask Imaging Spectrometer (COMIS-TTM) as it underwent another outburst (in’t Zand 2004). During the Rossi X-ray Timing Explorer (RXTE) era, five outbursts were recorded (Fig. 2 in Ng et al. 2024), and the source was identified as an Atoll source (Bhattacharyya et al. 2006a). During the 2003 outburst, 1A 1744−361 exhibited a complex dipping phenomenon, believed to be caused by structured material in the accretion disk obscuring the line of sight. Bhattacharyya et al. (2006b), by analyzing the time intervals between two subsequent sets of dips observed with RXTE, estimated the orbital period of the system to be approximately 97 ± 22 minutes. However, the actual orbital period could potentially be either half or twice this value. In the subsequent 2008 outburst, Chandra’s persistent spectrum showed a significant absorption feature at 6.961 keV (Gavriil et al. 2012). Similarly, during the 2022 outburst, Nuclear Spectroscopic Telescope Array (NuSTAR) observed comparable absorption features at approximately 6.91 keV and 7.99 keV (Tobrej et al. 2023; Mondal et al. 2024). The 2022 outburst was extensively observed by NICER (Ng et al. 2024). However, these observations only partially covered the outburst, with the most extensive coverage focusing on the fading phase. For transient sources, comprehensive coverage is important for understanding their evolutionary behavior. Therefore, filling the observational gap in the rising phase is essential for studying the outburst evolution of 1A 1744−361. We address this gap by analyzing observations during the rising phase of the 2024 outburst (Sects. 3.1, 3.2, and 3.3).
Type-I X-ray bursts from this source have rarely been reported and analyzed in the literature. Throughout its observational history, only three definitive type-I X-ray burst events have been detected by RXTE (Bhattacharyya et al. 2006b; Gavriil et al. 2012). These three bursts lack detailed follow-up studies, except for a report in Bhattacharyya et al. (2006b), which noted burst oscillations during the 2005 burst with a frequency of ∼530 Hz and a peak burst flux of 1.9 × 10⁻⁸ erg cm−2 s−1. Considering that the peak flux of a type-I X-ray burst should be below the Eddington limit, the upper limit for the distance of this source is constrained to 9 kpc.
The 2024 outburst of 1A 1744−361 was first detected by the Einstein Probe/Wide-field X-ray Telescope (EP/WXT) during its observation on June 16, and was subsequently monitored by Insight-HXMT and NICER (Xu et al. 2024; Cheng et al. 2024). In this paper, we provide the detailed properties of 1A 1744−361, covering both its persistent emission and type-I X-ray burst properties. In Sect. 2 introduce the observations from various satellites and describe the data processing procedures. In Sect. 3 we provide the evolutionary properties of the persistent emission during the 2024 outburst and report the type-I X-ray burst behavior of this source. Our discussion focuses on constructing a comprehensive picture of 1A 1744−361’s outburst evolution by integrating historical outburst observations and the ∼1 Hz QPO detected in island state.
2. Observations and data analysis
2.1. NICER
The Neutron star Interior Composition Explorer (NICER) is an X-ray mission mounted on the International Space Station that operates in the energy range 0.2−12 keV (Gendreau et al. 2016). During the 2024 outburst of 1A 1744−361, NICER performed 10 observations, as detailed in Table A.1. We performed data reduction using HEASoft v6.34, NICERDAS version 13, and the NICER CALDB release xti20240206. To produce cleaned event files, we applied standard filtering criteria, including a pointing stability better than 0.015°, a bright Earth limb angle greater than 30°, a dark Earth limb angle greater than 15°, exclusion of time intervals affected by the South Atlantic Anomaly, and total overshoot and undershoot count rates from all focal plane modules below 1200 and 1000 cts/s, respectively. We used “nicerl2” to extract screened event files, followed by “nicerl3-spect” and “nicerl3-lc” to extract spectra and light curves, respectively. Background estimation for both the spectrum and the light curve was performed using the “SCORPEON” background model. By carefully examining the light curves of each observation, we identified a type-I X-ray burst in observation ID 7202800102. Additionally, the interval affected by high overshoot count rates was detected in observation ID 72028001071. Therefore, in the subsequent analysis of persistent emission, we excluded the interval associated with the type-I X-ray burst (MJD 60513.83298−60513.83472) and the interval affected by overshoot (MJD 60518.86931−60518.871901). All times reported in this paper are in terrestrial time (TT).
We used screened event files to create the CCD, hardness-intensity diagram (HID), and PDSs, as the background count rate of NICER is below 2 cts/s and negligible compared to the source count rate (≳50 cts/s). This ensures that net light curves and event-based methods do not produce significant differences. In this study, we constructed a PDS with a time resolution of 0.2 milliseconds over a 16 second interval. The PDS was normalized according to the Miyamoto method (Miyamoto et al. 1991). The frequency range for calculating the rms amplitude of each component in the power spectrum is from 0.0625 Hz to 50.0 Hz.
2.2. Insight-HXMT
The Hard X-ray Modulation Telescope (Insight-HXMT) is China’s first space astronomy satellite dedicated to X-ray observations. It was successfully launched on June 15, 2017, and covers an energy range of 1−250 keV (Zhang et al. 2018, 2020). Insight-HXMT is primarily composed of three detectors: High Energy X-ray telescope (HE; 30−250 keV; Zhang et al. 2014), Medium Energy X-ray telescope (ME; 10−30 keV; Cao et al. 2020), and Low Energy X-ray telescope (LE; 1−10 keV; Chen et al. 2020). We processed Insight-HXMT data using the standard data processing software HXMTDAS v2.062. Insight-HXMT’s observations of the 2024 outburst were mainly concentrated in its early stages, with detailed observational information provided in Table A.2. Due to the lack of good time intervals for LE data and the background dominance in the HE energy range, we only extracted spectral and light curve data from the ME. No type-I X-ray bursts were identified in Insight-HXMT’s observations.
3. Results
3.1. Outburst evolution
We collected observations from NICER and Insight-HXMT to conduct a comprehensive analysis of the 2024 outburst. These observational details are listed in Tables A.1 and A.2. We marked the locations of these observations on the MAXI light curve, as shown in Fig. 1, to gain a preliminary understanding of the outburst and the existing observations. It can be seen that NICER provides the most comprehensive coverage, spanning the entire rising phase and part of the fading phase of the outburst. Insight-HXMT observations are mainly concentrated between MJD 60509 and 60511, with an additional observation at MJD 60514.53, near NICER observation ID 7202800103.
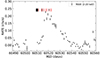 |
Fig. 1. MAXI light curve of the 2024 outburst of 1A 1744−361. The vertical black and red lines represent the observation times of Insight-HXMT and NICER, respectively. |
We first plotted the CCD and HID, as these are commonly used methods for analyzing the evolution of NS LMXBs. We selected NICER data to generate the CCD and HID because NICER’s observations provide the broadest time coverage among all datasets. The energy bands for CCD and HID were chosen to be consistent with those in Ng et al. (2024), facilitating a comparison of the 2024 outburst with the 2022 outburst. The resulting diagrams are shown in Fig. 2.
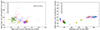 |
Fig. 2. CCD (left) and HID (right) of the persistent emission of the 2024 outburst observed by NICER. Different colors correspond to different observations, and each point represents a 32-second data segment. Soft color is defined as the ratio of the count rates in the 1.8−3.5 keV band to those in the 0.5−1.8 keV band, while hard color is defined as the ratio of the count rates in the 5.2−6.8 keV band to those in the 3.5−5.2 keV band. The energy band selections for the CCD and HID are consistent with those in Ng et al. (2024). |
3.2. Timing properties of persistent emission
Since the evolution of Atoll sources is not as rapid as that of Z sources, the CCD shown in Fig. 2 indicates that the soft and hard intensities for each observation are relatively concentrated. Therefore, we can analyze the timing and spectral evolution of the 2024 outburst of 1A 1744−361 on a per-observation basis (detailed spectral analysis is provided in Sect. 3.3).
First, we examined the PDS for each NICER observation. We found that as the outburst progressed (with the spectral state becoming softer), the rms amplitude of the PDS gradually decreased. The PDS shapes can generally be classified into three phases:
1. Between observations 7202800101(MJD 60511.50) and 7202800103(MJD 60514.37), we identified a significant QPO structure with a QPO frequency around 1 Hz. We utilized a Lorentzian component to characterize this feature and a power-law component to describe the remaining noise spectrum.
2. After MJD 60515.56, corresponding to observation 7202800104, the total power decreases with frequency in a power-law fashion, and the PDS can be described by a power-law component.
3. Due to the relatively low rms in PDSs, we combined observations 7202800107−7202800110 for analysis. During this period, the PDS still exhibits a power-law shape, but the rms decreases to a lower value of approximately 2.47%. An example of the evolution of PDS properties is shown in Fig. 3, and detailed PDS fitting results are provided in Table 1.
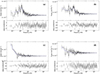 |
Fig. 3. PDS (0.5−10 keV) examples of the persistent emission. Panel a: ObsID 7202800102. Panel b: ObsID 7202800103. Panel c: ObsID 7202800105. Panel d: Combined ObsIDs 7202800107−110. The consistently stable power at high frequencies represents the white noise component. |
PDS fitting results of the persistent emission and burst observed by NICER (0.5−10 keV).
These results are based on the 0.5−10 keV energy band. Due to statistical limitations, a detailed study of the energy dependence of QPO rms is challenging. We attempted to measure the QPO rms in both the soft (0.5−2.0 keV) and hard (2.0−10.0 keV) energy bands. For observation 7202800102, the QPO rms is 11.01% ± 1.72% in the 0.5−2.0 keV band and 13.29% ± 3.16% in the 2.0−10.0 keV band. While the values appear comparable, the two energy bands are adjacent and relatively narrow, which makes it difficult to draw clear conclusions about the energy dependence of the QPO. Between observations 7202800101 and 7202800103, the QPO frequency slightly evolved from 0.98 Hz to 2.18 Hz, with the QPO rms ranging between 7.91% and 12.77%. This phenomenon was previously reported in Bhattacharyya et al. (2006a) and identified as the ∼1 Hz QPO, but has rarely been observed in subsequent observations of this source. In observation 7202800102, we detected a type-I X-ray burst. We plotted the burst light curve with a time bin of 0.3 s, as shown in Fig. 4. Panel 1 of Fig. 4 (top to bottom) displays the overall profile of the type-I X-ray burst, including the pre-burst persistent emission and the burst phase. Panels 2 and 3 show detailed light curves of the burst phase and pre-burst persistent emission, respectively, where clear QPO cycles can be seen in both the burst and persistent emission. We also performed PDS analysis on the burst emission, revealing a significant QPO signal in the PDS (shown in Fig. 5; fitting parameters are listed in Table 1). The QPO rms during the burst is ∼10.53%, consistent with that of the persistent emission. The QPO frequency during the burst is 1.72 ± 0.08 Hz, which appears to be potentially higher than the 1.51 ± 0.18 Hz observed in the persistent emission. The phenomenon of QPO frequency drift during outbursts has also been observed in ∼1 Hz QPO sources. For EXO 0748−676, a frequency drift of approximately 0.1 Hz between QPO frequencies during bursts and outside of bursts was similarly reported (Homan et al. 1999).
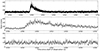 |
Fig. 4. Persistent emission and type-I X-ray burst profile light curve observed in ObsID 7202800102. The observation started at MJD 60513.70320 (TT). Panel 1 (from top to bottom) shows the type-I X-ray burst profile. Panels 2 and 3 present more detailed light curves with a magnified time axis for the type-I X-ray burst and the pre-burst persistent emission, respectively. Each data point has a time bin of 0.3 seconds. |
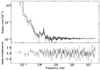 |
Fig. 5. PDS (0.5−10 keV) during the type-I X-ray burst. |
Dipping atoll sources exhibit the ∼1 Hz QPO phenomenon in their island state, and the QPO disappears when the spectral state transitions into the soft banana state (Homan 2012). The CCD shape derived from NICER data differs from the traditional C-shaped structure observed in broader energy bands, it remains challenging to determine the spectral state based solely on its position within the CCD trajectory. However, combined with the PDS analysis, we identify that 1A 1744−361 was likely in the “island” state (or hard state) before observation 7202800104(MJD 60515.56), transitioning into the “banana” state after observation 7202800104. This conclusion is also supported by the spectral fitting of persistent emission.
Furthermore, a 7−8 Hz QPO signal was identified in the banana state during the 2022 outburst, corresponding to a soft color range of 0.6−0.66 and a hard color range of 0.22−0.26 on the CCD (Ng et al. 2024). However, no significant QPO signals were detected in the corresponding spectral state of the 2024 outburst. The QPO signals observed in 2022 were classified as Normal Branch QPO (NBO)-like QPOs, which are expected to appear at high count rates (Wijnands et al. 1999; Wijnands & van der Klis 1999; Motta et al. 2017). Consistently, these NBO-like QPOs in 2022 occurred at relatively high count rates, exceeding 800 cts/s (NICER, 0.5−6.8 keV). In contrast, during the 2024 outburst, the source did not reach such high count rates. When the count rate approached spectral states similar to those in 2022, it peaked at only about 550 cts/s (NICER, 0.5−6.8 keV). This discrepancy in count rates may explain why no NBO-like QPOs were detected in the 2024 outburst.
3.3. Spectral analysis of persistent emission
Thanks to the long-term observational coverage of NICER, we can utilize its data to study the spectral evolution of the persistent spectrum of 1A 1744−361 during its 2024 outburst. The spectra in energy band 0.6−10.0 keV were fitted by continuum models to describe the persistent emission (Ng et al. 2024). Considering the competing models for the spectral components of NS LMXBs during low luminosity (island state/hard state) periods, we first conducted spectral fitting for observations at the outburst peak (ObsIDs 7202800106−7202800110). The behavior in the CCD and PDS indicates a banana state (soft state), where an accretion disk component is expected to be prominent in the spectrum.
For ObsID 7202800106 as an example, we initially fitted the spectrum with the model tbabs*diskbb with wilms abundances (Wilms et al. 2000). Significant residual structures appeared, indicating that the spectrum of 1A 1744−361 in the soft state cannot be described solely by a single diskbb component, consistent with the historical understanding that NS LMXBs generally exhibit both the soft and hard spectral components (Lin et al. 2007). We then added an additional component to fit the spectrum, testing models tbabs*(diskbb+bbodyrad), tbabs*(diskbb+powerlaw), and tbabs*(diskbb+nthcomp). The goodness of fit (χ2/d.o.f.) for these models was 122.34/138, 139.91/138, and 118.92/137, respectively. While all three models yielded acceptable fits, the diskbb normalization values in the last two models were 4.90 and 7.20, respectively, corresponding to unrealistically small inner disk radii of 3.9 km and 4.7 km. The physical inner radius of the disk is given by  , where N is the diskbb normalization, i is the disk inclination, fcol is the color correction (hardening factor, assumed to be 1.7; Shimura & Takahara 1995),
  represents the geometric correction factor described in Kubota et al. (1998), and D10 = D/10 kpc is the normalized distance. In this work, we adopted the upper distance limit of 9 kpc for the source, which yielded D10 = 0.9 (Bhattacharyya et al. 2006b). For disk inclination i, previous observations of this source have reported periodic dips caused by structured material in the accretion disk obscuring the emission. Such dips are only visible at an inclination angle of 60° ≤i ≤ 80° (Frank et al. 1987). Thus, we assumed the disk inclination to be 75°.
In contrast, the tbabs*(diskbb+bbodyrad) model produced a disk temperature of  keV, a normalization of
  (corresponding to a disk radius of
  km), a blackbody temperature of
  keV, and a normalization of
  , values more consistent with the disk temperature and inner radius expected in the soft state. The additional blackbody component can be interpreted as arising from the boundary layer at the transition between the accretion disk and the NS surface, a feature commonly observed in the soft states of NS LMXBs (Lin et al. 2007).
Since the radiation components in the soft state are identified as the accretion disk (diskbb) and the boundary layer (bbodyrad) emission, during the outburst rising phase before fully entering the soft state, the disk component is expected to persist until the flux drops below a certain threshold, rendering the disk radiation very weak. We observed significant spectral evolution prior to ObsID 7202800106, as evidenced by the dispersed distribution in the CCD and the changes in soft and hard colors across different observations. Although the spectrum can still be described by the tbabs*(diskbb+bbodyrad) model, the normalization of diskbb was very small, and the NH was inconsistent with the measurements during the banana state.
Burst detected in the 2024 outburst of 1A 1744−361.
Taking ObsID 7202800103 as an example, when applying the banana (soft) state model, the disk temperature was ∼0.68 keV, with a normalization of ∼46.38 (corresponding to a disk radius of ∼12.05 km), far below the values observed in the banana state. This result contradicts the general understanding that the disk should move inward as the outburst transitions to the soft state. Moreover, the NH in this case was 0.29 × 1022 cm−2, inconsistent with the banana (soft) state’s stable value of approximately 0.43 × 1022 cm−2 (an average NH value from the banana state observations). Therefore, for Observations 7202800102−7202800104, we employed the model tbabs*(diskbb+nthcomp) to describe the spectrum. We linked the seed photon temperature of nthcomp to the disk temperature, implying that the disk serves as the seed photon source for subsequent Compton scattering. This assumption aligns with the general understanding of the spectral emission of island states in Atoll sources (Done et al. 2007). This model provided a better goodness of fit (χ2/d.o.f.:100.91/127) compared to the tbabs*(diskbb+bbodyrad) model (χ2/d.o.f.:188.88/128) and shows that the NH (red points in Fig. 7) is consistent with the banana state (black points in Fig. 7). The results indicate that, from observation 7202800103 (hard state) to 7202800106 (soft state), the accretion disk temperature increased from  to
to  keV, while the inner disk radius decreased from
  to
to  km.
km.
We also cross-verified the robustness of this model using simultaneous observations from NICER and Insight-HXMT on MJD 60514 (Fig. 6). The tbabs*(diskbb+nthcomp) model effectively described the spectrum even in broader energy ranges. A comparison of the broad-band joint fitting results with NICER-only results is shown in Fig. 7, indicating consistent fits, though the electron temperature obtained in the broader energy range was slightly higher than NICER’s narrower energy range.
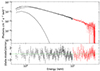 |
Fig. 6. NICER and Insight-HXMT joint fitting using model tbabs(diskbb+nthcomp). The black and red data points and residuals represent NICER (0.6−10 keV) and Insight-HXMT ME (10−30 keV), respectively. |
For ObsID 7202800101, during the early outburst phase, the diskbb component was no longer significant, and a single Comptonized component (nthcomp) modulated by tbabs sufficed to describe the spectrum. The complete spectral fitting results throughout the outburst are shown in Fig. 7.
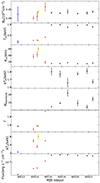 |
Fig. 7. Persistent spectral parameter evolution during the 2024 outburst. The black triangles represent the fitting results of the model tbabs*(diskbb+bbodyrad), the red triangles the fitting results of tbabs*(diskbb+nthcomp), and the blue triangles the fitting results of tbabs*nthcomp. The yellow squares represent the results of joint fitting between Insight-HXMT ME and NICER, while triangles in other colors correspond to the fitting results based on NICER data alone. The flux calculated here is the bolometric flux (unabsorbed) in the 0.6−10 keV range. |
3.4. Time-resolved spectrum of type-I X-ray bursts
We employed the traditional method for analyzing type-I X-ray bursts, using the emission from 130 to 50 seconds prior to the burst peak (pre-burst spectrum) as the background and the burst emission as source plus background, allowing XSPEC to extract the net burst spectrum. We performed time-resolved spectral analysis for the burst. The time bins for the time-resolved analysis were determined based on the photon statistics of the burst with 2 seconds. We used the canonical blackbody model tbabs*bbodyrad to fit these burst spectra but got the reduced  around at the burst peak phase.
To address these residuals, we adopted the fa model, which includes an additional variable persistent spectral component in the fitting process (Worpel et al. 2013). The model is: N(E) = tbabs*bbodyrad + fa * P(E), where N(E) is the net burst spectrum, fa is a dimensionless multiplicative factor, and P(E) is the persistent emission model with all parameters fixed to the values obtained from the pre-burst fit. This model significantly improved the goodness of fit for the burst and results in reduced  with d.o.f. 10−30 around the burst peak. The fitting results are presented in Fig. 8.
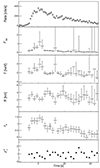 |
Fig. 8. Time-resolved spectrum of the burst observed by NICER using the fa model. This includes the time evolution of the count rate, the blackbody bolometric flux (Fbb), the temperature (kTbb), the observed radius (R), fa, and the goodness of fit ( |

The peak flux reached approximately  erg/cm2/s (see Table 2), which corresponds to 0.66 LEdd, where the pure hydrogen Eddington limit (LEdd = 1.8 × 1038 erg s−1) is considered, assuming a distance of 9 kpc (Bhattacharyya et al. 2006b). It is expected that the time-resolved spectral analysis did not display the typical characteristics associated with photospheric radius expansion type-I X-ray bursts.
The blackbody temperature of the burst decreased from a peak value of  keV as the burst entered its decay phase. The derived blackbody radius was approximately 2−4 km along the entire burst phase, assuming a distance of 9 kpc. The derived fa reaches its peak 1.4 ± 0.2 at the burst peak, which corresponds ∼10% peak flux of the burst.
Please note that some error bars above for the derived blackbody parameters are quite large. This could be attributed to the degeneracy between the blackbody component and the variable persistent emission, as well as the low count rate of the burst (a similar effect can be seen in the comparison between the pure blackbody model and the fa model in Güver et al. 2022). We performed the burst oscillation search using a sliding-window method over the 0.5−10 keV energy range (Watts 2012). The window size was 10 s, sliding in steps of 0.5 s. We applied the Zn2 search method with the number of harmonics n set to 1 and 2. The frequency range searched was 510−550 Hz, with a resolution of 0.01 Hz, based on previous reports of burst oscillations around 530 Hz (Bhattacharyya et al. 2006b). The search was conducted from 20 s before to 60 s after the burst peak. No periodic signal exceeding 3σ significance was detected.
4. Discussion
As a transient source, 1A 1744−361 has been sparsely observed over the years. RXTE detected outbursts in 2003, 2004, and 2005, but the short exposures were insufficient to capture complete outburst cycles (Bhattacharyya et al. 2006a). NICER later observed the fading phase of the 2022 outburst (Ng et al. 2024). In 2024, NICER and Insight-HXMT provided a rare opportunity to study the source in detail, particularly during the rising phase of the outburst and the associated type-I X-ray burst. NICER observations were used to trace the evolution of the persistent emission, while joint spectral fitting with Insight-HXMT helped constrain the broadband spectral properties. Both instruments were also used to search for type-I X-ray bursts, with NICER detecting one burst.
4.1. A probable scenario for the outburst evolution of 1A 1744–361
To provide a more complete picture of the outburst evolution of 1A 1744−361, we first compared the CCD and HID of NICER observations during the 2022 and 2024 outbursts (see more details in Ng et al. 2024). We found that the peak count rate of the 2022 outburst (approximately 1000 cts/s for NICER, 0.5−6.8 keV) was higher than that of the 2024 outburst, which peaked at around 550 cts/s (0.5−6.8 keV). However, the spectral state at the peaks of the two outbursts is consistent, as their peak positions on the CCD diagram are similar, with the soft color between 0.6 and 0.7 and the hard color between 0.2 and 0.3. Thus, by combining the rising phase of the 2024 outburst reported in this paper with the fading phase of the 2022 outburst, we can derive a complete picture of the evolution of 1A 1744−361’s outburst radiation properties.
During the rising phase of the outburst, when NICER’s count rate was below ∼287 cts/s and the flux was lower than 1.17 × 10⁻⁹ erg/cm2/s (0.5−10 keV), the PDS comprises a ∼1 Hz QPO component and a power-law noise component, consistent with the island state PDS observed for this source by RXTE (Bhattacharyya et al. 2006a). As the outburst progressed and the count rate and flux increased, QPO disappears, the PDS evolved into a power-law shape throughout the soft state. However, during the fading phase of the outburst (see the fading phase of the 2022 outburst for details; Ng et al. 2024), the PDS remained in a power-law shape until the end of the outburst. This suggests that during the fading phase, even when the spectral state transitioned into the island state, but the PDS could not revert to the rising phase’s shape, no QPO signal was detected during the island state in the fading phase of outburst. This implies an interesting behavior that may result from different physical processes during the rising and fading phases of outburst (Muñoz-Darias et al. 2014). Furthermore, QPOs at 7−8 Hz detected during the 2022 outburst were classified as NBO-like QPOs (Ng et al. 2024), a type typically observed in Z sources (Motta et al. 2017). Interestingly, similar QPOs have also been reported near the peak of the banana state in several Atoll sources, including Aql X-1, XTE J1806−246, and 4U 1820−30, suggesting a possible common physical origin (Wijnands & van der Klis 1999; Wijnands et al. 1999; Reig et al. 2004). Our results indicate that, in 1A 1744−361, the occurrence of NBO-like QPOs may be restricted to high-luminosity states, corresponding to high accretion rates. During the 2022 outburst, the source reached a peak luminosity of ∼3.3 × 1037 erg/s (0.6−10 keV, assuming an upper distance limit of 9 kpc), and NBO-like QPOs were detected. In contrast, during the 2024 outburst, the peak luminosity was ∼2.4 × 1037 erg/s (0.6−10 keV), not reaching a comparable level, and no significant NBO-like QPOs were detected. This discrepancy further supports a correlation between the presence of NBO-like QPOs and the accretion rate, and suggests that the accretion rate may be a key parameter distinguishing Atoll sources from Z sources.
The variation in spectral parameters, combined with the rising phase in 2024 and the fading phase in 2022, offers a complete picture of the disk’s evolution. Our constraints on the disk are reliable, as the hydrogen column density (NH) is expected to remain stable, assuming the outburst does not introduce additional local absorption. As shown in Fig. 7, even when different models were used at various outburst stages, the NH values remained consistent. This supports the validity of our model selection, as NH is highly sensitive to low-energy components, which means that our constraints on the diskbb low-energy component are reasonable and reliable.
During the early stage of the outburst (island state), Rin was much larger than at the outburst peak. As the outburst progressed, Rin decreased from ∼60 km to ∼15 km, stabilizing during the peak (banana state). This is consistent with the evolutionary picture of a truncated accretion disk gradually moving closer to the compact star during the outburst (Done et al. 2007).
At the outburst peak, the inner radius of the accretion disk stabilizes at approximately 15 km. This radius is slightly larger than the expected radius of a NS (10 km). Between the accretion disk and the NS, a boundary layer or spreading layer is theoretically expected, which should be optically thick in the soft state (Grebenev & Sunyaev 2002; Gilfanov et al. 2003; Suleimanov & Poutanen 2006). This aligns with the blackbody component we identified in the spectral fitting. The blackbody component has a temperature of approximately 1.8 keV, generally consistent with the theoretical expectations for the boundary layer (Popham & Sunyaev 2001). If this blackbody component corresponds to the boundary layer, its equivalent radiation radius  , where we used fcol = 1.41 obtained by Suleimanov et al. (2012). Therefore, the equivalent radius of the banana state under high flux is approximately 9.66 km. Assuming a simple picture that the boundary layer is a blackbody-radiating annulus surrounding the NS, with its outer boundary connecting to the accretion disk (i.e., Rout, BL = Rin), we derive

which is consistent with the expected scenario where the boundary layer bridges the NS surface and the accretion disk. We note that this estimate of Rin, BL = 11.5 km is based on a simplified assumption that the boundary layer is a thin structure extending horizontally from the inner disk. In reality, some studies (Inogamov & Sunyaev 1999; Popham & Sunyaev 2001) suggest that the boundary layer may have a vertical extent and latitudinal spread over the NS surface. While the derived radius should not be interpreted as a direct measurement of the emission geometry, its value is broadly consistent with the expected physical location of the boundary layer between the disk and the NS.
4.2. ∼1 Hz QPO
The ∼1 Hz QPOs has been observed in multiple eclipsing and dipping NS LMXBs. Specific cases include 4U 1323−62 (0.77−0.87 Hz), EXO 0748−676 (0.58−2.44 Hz), and 4U 1746−37 (1.01−1.59 Hz), all strongly associated with the hard state (island state; Homan et al. 1999; Jonker et al. 1999, 2000). Notably, ∼1 Hz QPOs are absent in soft-state sources (e.g., 4U 1624−49 and XB 1254−690; Lommen et al. 2005; Bhattacharyya 2007). Observations of 1A 1744−361 reveal ∼1 Hz QPOs at 0.98−2.18 Hz, showing frequency increases with rising outburst flux.
Previous sources exhibited energy independence in QPO rms (Homan et al. 1999). Though the statistics limits detailed energy-dependent rms analysis for 1A 1744−361, the presence of QPOs was detected in the burst, and the QPO rms in both the burst (10.53 ± 5.85%) and the persistent emission (12.77 ± 1.12%) is consistent with previously observed sources (Jonker et al. 1999). The rms energy independence of ∼1 Hz QPO observed in dipping and/or eclipsing sources suggests a connection to geometric dynamics in high-inclination (> 60°) systems, which potentially caused by periodic obscuration from a Lense-Thirring (LT) precessing structure of inner accretion disk (Homan 2012). The LT precession frequency near NSs can be expressed as (Stella & Vietri 1998)
 (1)
(1)
where I45 is the moment of inertia of the NS in units of 1045 g cm2, M is its mass, νspin is its spin frequency. And νK represents Keplerian frequency:
 (2)
(2)
where m1.4 are the compact object’s mass in units of 1.4 M⊙, and r is the orbital radius. Using the spectral fitting results from NICER ObsID 7202800102 (Rin = r = 37 km) and accounting for variations in the NS equation of state ( ; Friedman et al. 1986; Cook et al. 1994), the estimated LT precession frequency range is 1.09−4.36 Hz. Consequently, the observed QPO frequency of 1.51 Hz falls within this range, supporting its association with LT precession.
Although the origin of the obscuring structure in accretion disk remains unknown, the explanation of the obscuration origin of the ∼1 Hz QPO is indeed consistent with the energy-independent rms phenomenon and the current observational fact that ∼1 Hz QPOs only appear in the hard state (Homan 2012). In the hard state, the radiation of NS systems mainly originates from the central region of the NS or the surrounding boundary layer, whereas in the soft state, the disk radiation dominates. The fact that the QPO rms remains at the similar level during the burst as it does during the persistent emission period further supports this explanation. However, this also imposes some constraints on the radiation geometry, as a burst can ignite across the entire NS surface, enhancing emission from regions away from the equator, which is intrinsically harder to obscure due to its geometry. This would be manifested as a decrease in QPO rms during the burst. However, this hypothesis contradicts the observational facts (Jonker et al. 1999; Homan et al. 1999). We note that the analysis of the type-I X-ray burst in 1A 1744−361 indicates that the radius of the blackbody radiation is relatively small (∼4 km), significantly smaller than the NS radius. This suggests that the burst may have occurred as a small-area nuclear burning event near the equator of the NS, which could explain the stability of QPO rms during the burst. If this hypothesis holds, the bursts exhibiting the ∼1 Hz QPO phenomenon should have a smaller radiation radius and be located close to the equator, which could potentially be used to constrain the geometry of the obscuring material. To our knowledge, there is currently a lack of detailed spectral analysis of bursts with ∼1 Hz QPOs. Future detailed studies of such QPO-associated bursts may advance our understanding of the ∼1 Hz QPO phenomenon.
Acknowledgments
We thank the anonymous reviewer for valuable comments and suggestions. This work is supported by the National Key R&D Program of China (2021YFA0718500), International Partnership Program of Chinese Academy of Sciences (Grant No. 113111KYSB20190020) and the National Natural Science Foundation of China under grants 12333007, 12027803, 12173103 and 12261141691. This work made use of data from the Insight-HXMT mission, a project funded by China National Space Administration (CNSA) and the Chinese Academy of Sciences (CAS). The data of NICER obtained through the High Energy Astrophysics Science Archive Research Center (HEASARC). Pengju Wang is grateful for the financial support provided by the Sino-German (CSC-DAAD) Postdoc Scholarship Program (57678375). Lingda Kong is grateful for the financial support provided by the Sino-German (CSC-DAAD) Postdoc Scholarship Program (57607866).
References
- Barret, D. 2001, Adv. Space Res., 28, 307 [NASA ADS] [CrossRef] [Google Scholar]
- Bhattacharyya, S. 2007, MNRAS, 377, 198 [Google Scholar]
- Bhattacharyya, S., Strohmayer, T. E., Swank, J. H., et al. 2006a, ApJ, 652, 603 [Google Scholar]
- Bhattacharyya, S., Strohmayer, T. E., Markwardt, C. B., et al. 2006b, ApJ, 639, L31 [NASA ADS] [CrossRef] [Google Scholar]
- Cao, X., Jiang, W., Meng, B., et al. 2020, Sci. China Phys. Mech. Astron., 63, 249504 [NASA ADS] [CrossRef] [Google Scholar]
- Carpenter, G. F., Eyles, C. J., Skinner, G. K., et al. 1977, MNRAS, 179, 27P [Google Scholar]
- Chen, Y.-P., Zhang, S., Torres, D. F., et al. 2010, A&A, 510, A81 [NASA ADS] [CrossRef] [EDP Sciences] [Google Scholar]
- Chen, Y., Cui, W., Li, W., et al. 2020, Sci. China Phys. Mech. Astron., 63, 249505 [NASA ADS] [CrossRef] [Google Scholar]
- Chen, Y.-P., Zhang, S., Zhang, S.-N., et al. 2023, ApJ, 942, L12 [Google Scholar]
- Cheng, H. Q., Lian, T. Y., Pan, X., et al. 2024, ATel, 16735, 1 [Google Scholar]
- Cook, G. B., Shapiro, S. L., & Teukolsky, S. A. 1994, ApJ, 424, 823 [CrossRef] [Google Scholar]
- Done, C., Gierliński, M., & Kubota, A. 2007, A&ARv, 15, 1 [Google Scholar]
- Frank, J., King, A. R., & Lasota, J.-P. 1987, A&A, 178, 137 [Google Scholar]
- Friedman, J. L., Ipser, J. R., & Parker, L. 1986, ApJ, 304, 115 [NASA ADS] [CrossRef] [Google Scholar]
- Galloway, D. K., & Keek, L. 2021, Astrophys. Space Sci. Lib., 461, 209 [NASA ADS] [CrossRef] [Google Scholar]
- Galloway, D. K., Muno, M. P., Hartman, J. M., et al. 2008, ApJS, 179, 360 [Google Scholar]
- Gavriil, F. P., Strohmayer, T. E., & Bhattacharyya, S. 2012, ApJ, 753, 2 [NASA ADS] [CrossRef] [Google Scholar]
- Gendreau, K. C., Arzoumanian, Z., Adkins, P. W., et al. 2016, Proc. SPIE, 9905, 99051H [NASA ADS] [CrossRef] [Google Scholar]
- Gierliński, M., & Done, C. 2002, MNRAS, 337, 1373 [CrossRef] [Google Scholar]
- Gilfanov, M., Revnivtsev, M., & Molkov, S. 2003, A&A, 410, 217 [NASA ADS] [CrossRef] [EDP Sciences] [Google Scholar]
- Grebenev, S. A., & Sunyaev, R. A. 2002, Astron. Lett., 28, 150 [Google Scholar]
- Güver, T., Boztepe, T., Ballantyne, D. R., et al. 2022, MNRAS, 510, 1577 [Google Scholar]
- Hasinger, G., & van der Klis, M. 1989, A&A, 225, 79 [NASA ADS] [Google Scholar]
- Homan, J. 2012, ApJ, 760, L30 [Google Scholar]
- Homan, J., Jonker, P. G., Wijnands, R., et al. 1999, ApJ, 516, L91 [Google Scholar]
- Homan, J., Fridriksson, J. K., & Remillard, R. A. 2015, ApJ, 812, 80 [Google Scholar]
- Inogamov, N. A., & Sunyaev, R. A. 1999, Astron. Lett., 25, 269 [NASA ADS] [Google Scholar]
- in’t Zand, J. 2004, ATel, 268, 1 [Google Scholar]
- Ji, L., Zhang, S., Chen, Y.-P., et al. 2014, A&A, 564, A20 [NASA ADS] [CrossRef] [EDP Sciences] [Google Scholar]
- Jonker, P. G., van der Klis, M., & Wijnands, R. 1999, ApJ, 511, L41 [Google Scholar]
- Jonker, P. G., van der Klis, M., Homan, J., et al. 2000, ApJ, 531, 453 [Google Scholar]
- Kubota, A., Tanaka, Y., Makishima, K., et al. 1998, PASJ, 50, 667 [NASA ADS] [CrossRef] [Google Scholar]
- Lewin, W. H. G., & van der Klis, M. 2006, Compact Stellar X-ray Sources. Cambridge Astrophysics Series (Cambridge, UK: Cambridge University Press) [Google Scholar]
- Lin, D., Remillard, R. A., & Homan, J. 2007, ApJ, 667, 1073 [CrossRef] [Google Scholar]
- Lommen, D., van Straaten, S., van der Klis, M., et al. 2005, A&A, 435, 1005 [NASA ADS] [CrossRef] [EDP Sciences] [Google Scholar]
- Mitsuda, K., Inoue, H., Nakamura, N., et al. 1989, PASJ, 41, 97 [Google Scholar]
- Miyamoto, S., Kimura, K., Kitamoto, S., et al. 1991, ApJ, 383, 784 [NASA ADS] [CrossRef] [Google Scholar]
- Mondal, A. S., Raychaudhuri, B., & Dewangan, G. C. 2024, MNRAS, 527, 2362 [Google Scholar]
- Motta, S. E., Rouco Escorial, A., Kuulkers, E., et al. 2017, MNRAS, 468, 2311 [NASA ADS] [CrossRef] [Google Scholar]
- Muñoz-Darias, T., Fender, R. P., Motta, S. E., et al. 2014, MNRAS, 443, 3270 [CrossRef] [Google Scholar]
- Ng, M., Hughes, A. K., Homan, J., et al. 2024, ApJ, 966, 232 [Google Scholar]
- Popham, R., & Sunyaev, R. 2001, ApJ, 547, 355 [NASA ADS] [CrossRef] [Google Scholar]
- Reig, P., van Straaten, S., & van der Klis, M. 2004, ApJ, 602, 918 [Google Scholar]
- Shimura, T., & Takahara, F. 1995, ApJ, 445, 780 [Google Scholar]
- Stella, L., & Vietri, M. 1998, ApJ, 492, L59 [NASA ADS] [CrossRef] [Google Scholar]
- Suleimanov, V., & Poutanen, J. 2006, MNRAS, 369, 2036 [NASA ADS] [CrossRef] [Google Scholar]
- Suleimanov, V., Poutanen, J., & Werner, K. 2012, A&A, 545, A120 [NASA ADS] [CrossRef] [EDP Sciences] [Google Scholar]
- Tobrej, M., Rai, B., Ghising, M., et al. 2023, MNRAS, 526, 2032 [Google Scholar]
- van der Klis, M. 2004, ArXiv e-prints [arXiv:astro-ph/0410551] [Google Scholar]
- Watts, A. L. 2012, ARA&A, 50, 609 [Google Scholar]
- White, N. E., Stella, L., & Parmar, A. N. 1988, ApJ, 324, 363 [NASA ADS] [CrossRef] [Google Scholar]
- Wijnands, R., & van der Klis, M. 1999, ApJ, 522, 965 [Google Scholar]
- Wijnands, R., van der Klis, M., & Rijkhorst, E.-J. 1999, ApJ, 512, L39 [Google Scholar]
- Wilms, J., Allen, A., & McCray, R. 2000, ApJ, 542, 914 [Google Scholar]
- Worpel, H., Galloway, D. K., & Price, D. J. 2013, ApJ, 772, 94 [NASA ADS] [CrossRef] [Google Scholar]
- Xu, X. P., Wang, Y., Zhou, H., et al. 2024, ATel, 16714, 1 [Google Scholar]
- Zhang, S., Lu, F. J., Zhang, S. N., et al. 2014, Proc. SPIE, 9144, 914421 [NASA ADS] [CrossRef] [Google Scholar]
- Zhang, S., Zhang, S. N., Lu, F. J., et al. 2018, Proc. SPIE, 10699, 106991U [NASA ADS] [Google Scholar]
- Zhang, S.-N., Li, T., Lu, F., et al. 2020, Sci. China Phys. Mech. Astron., 63, 249502 [NASA ADS] [CrossRef] [Google Scholar]
Appendix A: NICER and Insight-HXMT observations
Exposure times and observed burst peak times of NICER observations.
Exposure times and observed burst peak times of Insight-HXMT observations.
All Tables
PDS fitting results of the persistent emission and burst observed by NICER (0.5−10 keV).
All Figures
|
Fig. 1. MAXI light curve of the 2024 outburst of 1A 1744−361. The vertical black and red lines represent the observation times of Insight-HXMT and NICER, respectively. |
| In the text | |
|
Fig. 2. CCD (left) and HID (right) of the persistent emission of the 2024 outburst observed by NICER. Different colors correspond to different observations, and each point represents a 32-second data segment. Soft color is defined as the ratio of the count rates in the 1.8−3.5 keV band to those in the 0.5−1.8 keV band, while hard color is defined as the ratio of the count rates in the 5.2−6.8 keV band to those in the 3.5−5.2 keV band. The energy band selections for the CCD and HID are consistent with those in Ng et al. (2024). |
| In the text | |
|
Fig. 3. PDS (0.5−10 keV) examples of the persistent emission. Panel a: ObsID 7202800102. Panel b: ObsID 7202800103. Panel c: ObsID 7202800105. Panel d: Combined ObsIDs 7202800107−110. The consistently stable power at high frequencies represents the white noise component. |
| In the text | |
|
Fig. 4. Persistent emission and type-I X-ray burst profile light curve observed in ObsID 7202800102. The observation started at MJD 60513.70320 (TT). Panel 1 (from top to bottom) shows the type-I X-ray burst profile. Panels 2 and 3 present more detailed light curves with a magnified time axis for the type-I X-ray burst and the pre-burst persistent emission, respectively. Each data point has a time bin of 0.3 seconds. |
| In the text | |
|
Fig. 5. PDS (0.5−10 keV) during the type-I X-ray burst. |
| In the text | |
|
Fig. 6. NICER and Insight-HXMT joint fitting using model tbabs(diskbb+nthcomp). The black and red data points and residuals represent NICER (0.6−10 keV) and Insight-HXMT ME (10−30 keV), respectively. |
| In the text | |
|
Fig. 7. Persistent spectral parameter evolution during the 2024 outburst. The black triangles represent the fitting results of the model tbabs*(diskbb+bbodyrad), the red triangles the fitting results of tbabs*(diskbb+nthcomp), and the blue triangles the fitting results of tbabs*nthcomp. The yellow squares represent the results of joint fitting between Insight-HXMT ME and NICER, while triangles in other colors correspond to the fitting results based on NICER data alone. The flux calculated here is the bolometric flux (unabsorbed) in the 0.6−10 keV range. |
| In the text | |
|
Fig. 8. Time-resolved spectrum of the burst observed by NICER using the fa model. This includes the time evolution of the count rate, the blackbody bolometric flux (Fbb), the temperature (kTbb), the observed radius (R), fa, and the goodness of fit ( |
| In the text | |
Current usage metrics show cumulative count of Article Views (full-text article views including HTML views, PDF and ePub downloads, according to the available data) and Abstracts Views on Vision4Press platform.
Data correspond to usage on the plateform after 2015. The current usage metrics is available 48-96 hours after online publication and is updated daily on week days.
Initial download of the metrics may take a while.