Fig. 1.
Download original image
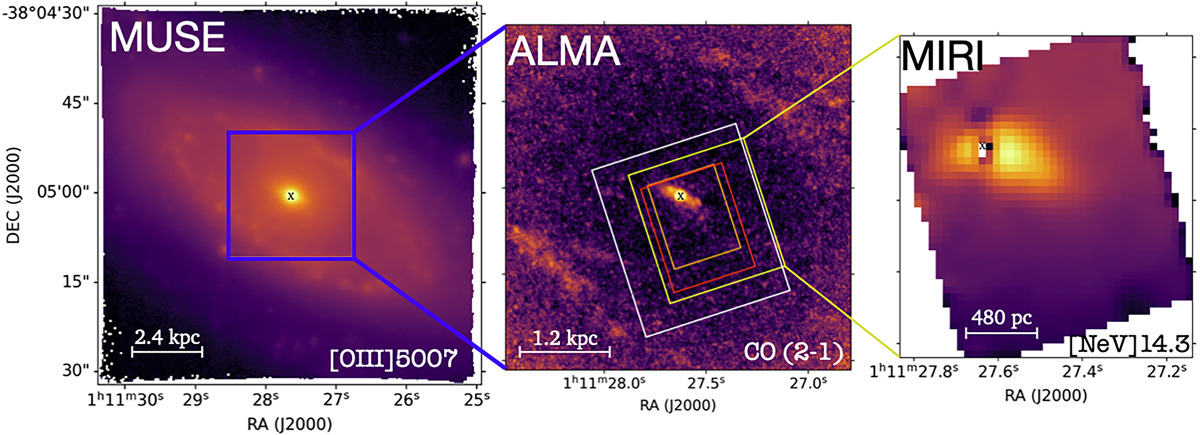
NGC 424 emission line images from MUSE WFM (left), ALMA (middle), and the point-source subtracted MIRI MRS Ch3 medium (right). The images were obtained integrating the total [O III]λ5007, CO (2-1), and [Ne V] emission lines, respectively. Blue square in MUSE image represents the ALMA FoV considered in this work. Orange, red, yellow, and white rectangles in ALMA image represent the FoVs of MIRI MRS Channels 1, 2, 3, and 4, respectively. Black crosses mark the nucleus position, determined as the peak of Hα emission from the MUSE data. North is up and east is left.
Current usage metrics show cumulative count of Article Views (full-text article views including HTML views, PDF and ePub downloads, according to the available data) and Abstracts Views on Vision4Press platform.
Data correspond to usage on the plateform after 2015. The current usage metrics is available 48-96 hours after online publication and is updated daily on week days.
Initial download of the metrics may take a while.