Fig. B.1.
Download original image
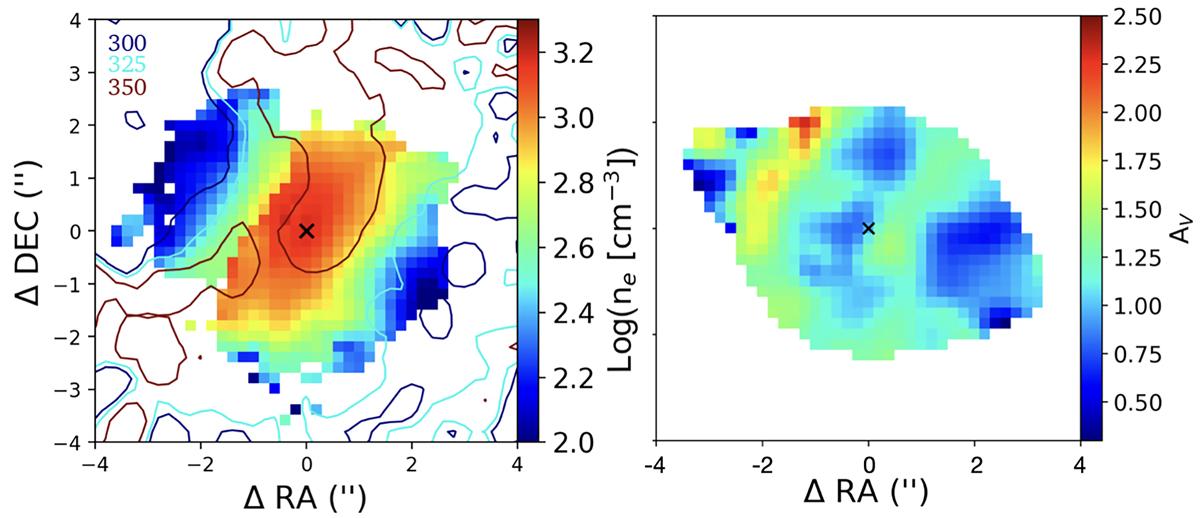
Spatially resolved estimate of the ionised gas electron density and dust attenuation in the circumnuclear region of NGC 424 obtained from the [SII]λλ6716,6731 doublet and Hα/Hβ ratio of MUSE data. Spaxels at S/N ≤ 5 are masked. Left panel: Red, cyan, and blue contours represent the 350, 325, and 300 km s−1 contours of the broad component of the [O III] velocity dispersion map shown in Fig. 6. North is up, east to the left.
Current usage metrics show cumulative count of Article Views (full-text article views including HTML views, PDF and ePub downloads, according to the available data) and Abstracts Views on Vision4Press platform.
Data correspond to usage on the plateform after 2015. The current usage metrics is available 48-96 hours after online publication and is updated daily on week days.
Initial download of the metrics may take a while.