Fig. 2.
Download original image
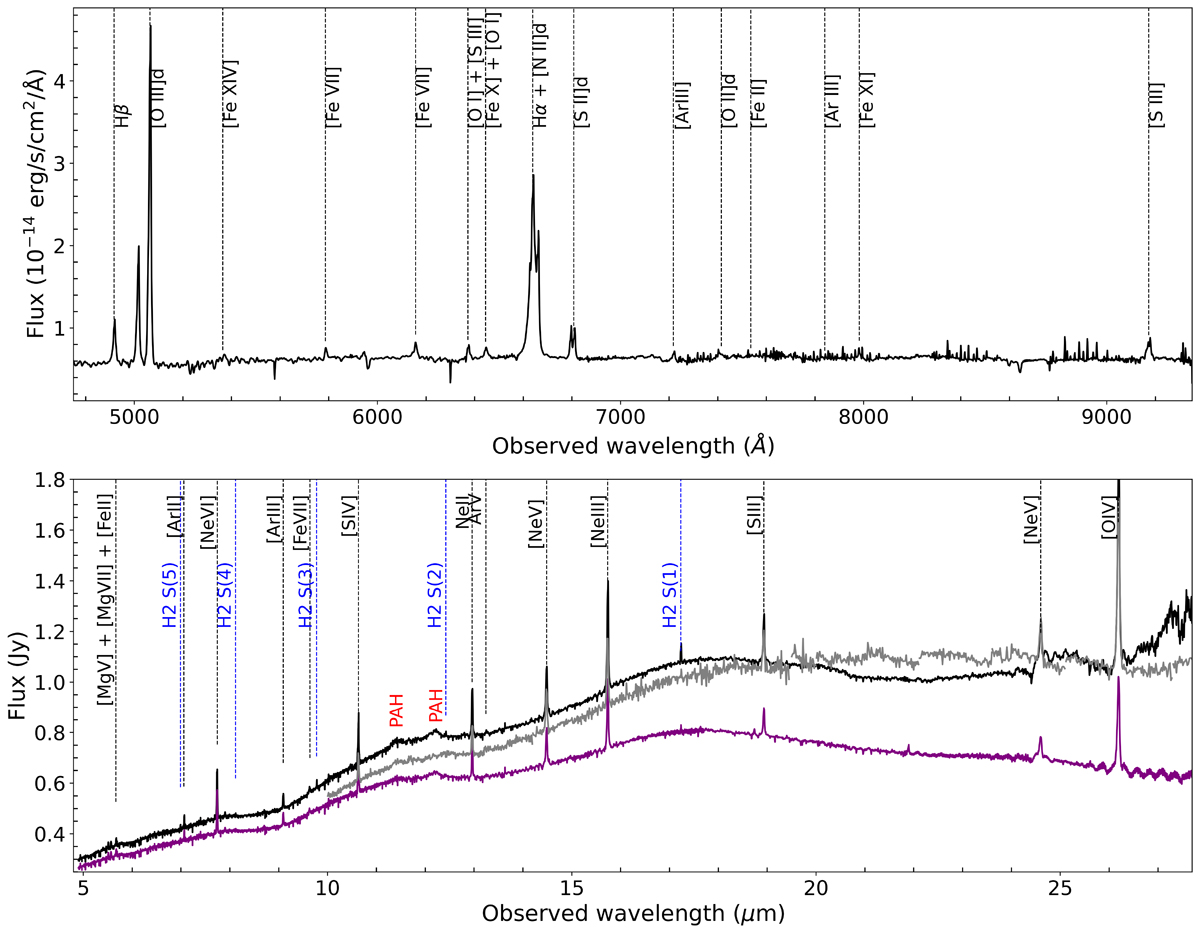
MUSE (top panel) and MIRI MRS (bottom panel) integrated spectra for NGC 424 extracted from the same region, i.e. the MIRI MRS Ch 1 (orange square in Fig. 1). All the emission lines detected in each spectrum are highlighted. Warm molecular hydrogen transitions in the MIRI MRS spectrum are shown in blue. Black and purple spectra in the bottom panel represent the integrated MRS spectrum extracted from the entire FoV and from the 1 arcsec2 nuclear region of NGC 424, respectively. Red labels mark the positions of PAHs features at 11.25 and 12 μm. Grey spectrum in the bottom panel is the Spitzer IRS high-resolution extracted in full mode normalised to the MIRI MRS integrated spectrum.
Current usage metrics show cumulative count of Article Views (full-text article views including HTML views, PDF and ePub downloads, according to the available data) and Abstracts Views on Vision4Press platform.
Data correspond to usage on the plateform after 2015. The current usage metrics is available 48-96 hours after online publication and is updated daily on week days.
Initial download of the metrics may take a while.