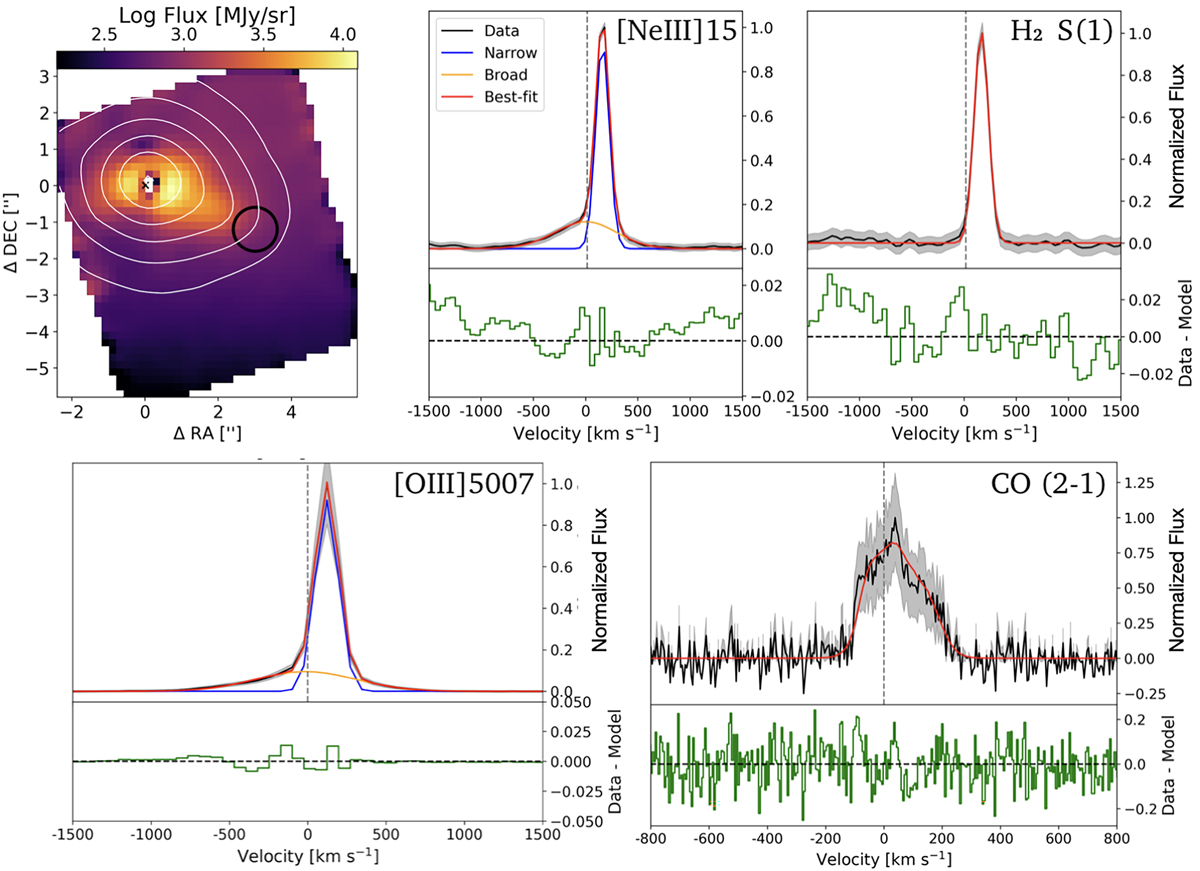
Fig. 3.
Download original image
Multi-phase Gaussian fit of the [Ne III], H2S(1), [O III]λ5007, and CO (2-1) emission lines from MIRI/MRS, MUSE, and ALMA data cubes, respectively. Top left panel: [Ne III] emission tracing the redshifted ionised gas, obtained collapsing the flux in the spectral window 15.56–15.57 μm rest-frame from the PSF subtracted data cube (see Appendix A). White contours represent arbitrary [OIII] flux levels from MUSE data. North is up and east is left. Top right panels: Integrated [Ne III] and H2S(1) emission extracted from the black circular aperture of radius 0.6″, shown on the left panel. Bottom left: Integrated [O III]λ5007 emission and best-fit extracted from the same aperture shown in the top left panel. Bottom right: Integrated CO (2-1) emission extracted from spaxels with S/N ≥ 3, covering the nuclear region of NGC 424, as is shown in the bottom panel of Fig. 4. Data and total best-fit model are in black and red, respectively. The sum of the single Gaussian best-fit components is shown in blue (narrow), and orange (broad). Bottom panels show the residuals in green. Vertical dashed grey lines mark the rest-frame wavelength of the transitions. Data and best-fit are normalised to the peak of the observed spectrum.
Current usage metrics show cumulative count of Article Views (full-text article views including HTML views, PDF and ePub downloads, according to the available data) and Abstracts Views on Vision4Press platform.
Data correspond to usage on the plateform after 2015. The current usage metrics is available 48-96 hours after online publication and is updated daily on week days.
Initial download of the metrics may take a while.