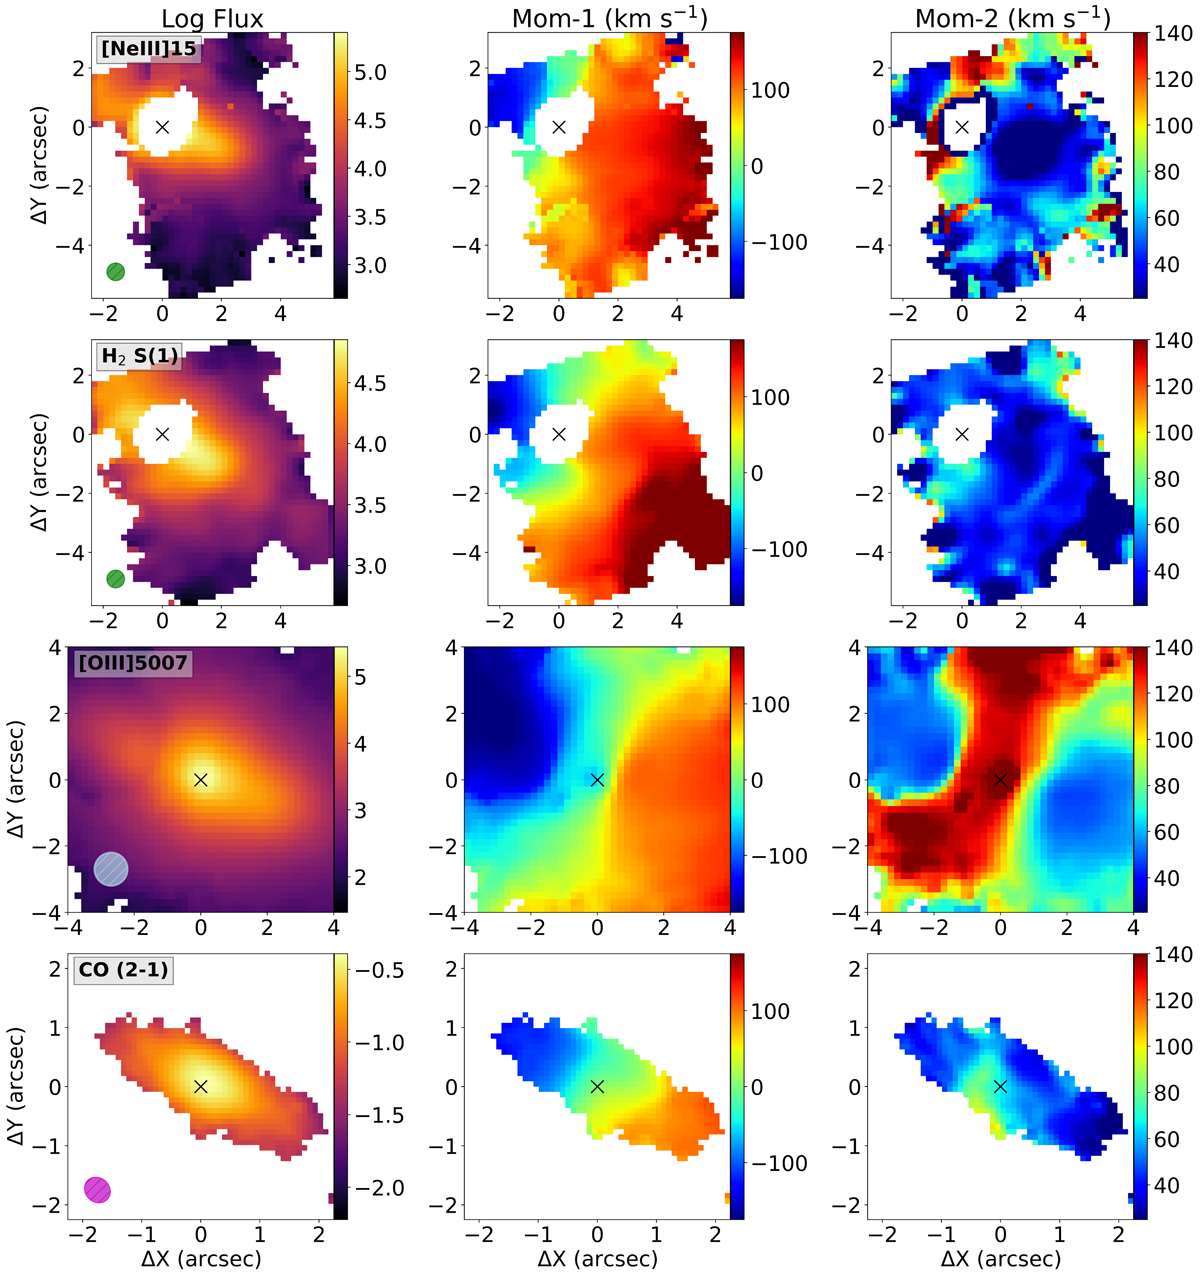
Fig. 4.
Download original image
From top to bottom: NGC 424 disc emission traced by [Ne III], H2S(1), [OIII], and CO (2-1) emission lines. The disc emission is traced by the total line profile of the H2S(1) and CO (2-1) transitions and by the narrower Gaussian component for the [Ne III] and [O III] emission lines. From left to right we show the emission line integrated flux, line of sight (LOS) velocity and velocity dispersion maps corrected for instrumental broadening. The integrated logarithmic flux maps are in unit of MJy/sr, 10−20 erg/s/cm−2, and Jy/beam for MIRI, MUSE, and ALMA maps, respectively. The green and grey circles are the MIRI and MUSE PSF, respectively. The ALMA beam is represented as a magenta oval. From top to bottom, a S/N mask of 3, 3, 5, and 3 was applied to moment maps. MIRI moment maps are obtained from the emission line fitting of the point-source subtracted data cube. North is up and east is left.
Current usage metrics show cumulative count of Article Views (full-text article views including HTML views, PDF and ePub downloads, according to the available data) and Abstracts Views on Vision4Press platform.
Data correspond to usage on the plateform after 2015. The current usage metrics is available 48-96 hours after online publication and is updated daily on week days.
Initial download of the metrics may take a while.