Fig. 5.
Download original image
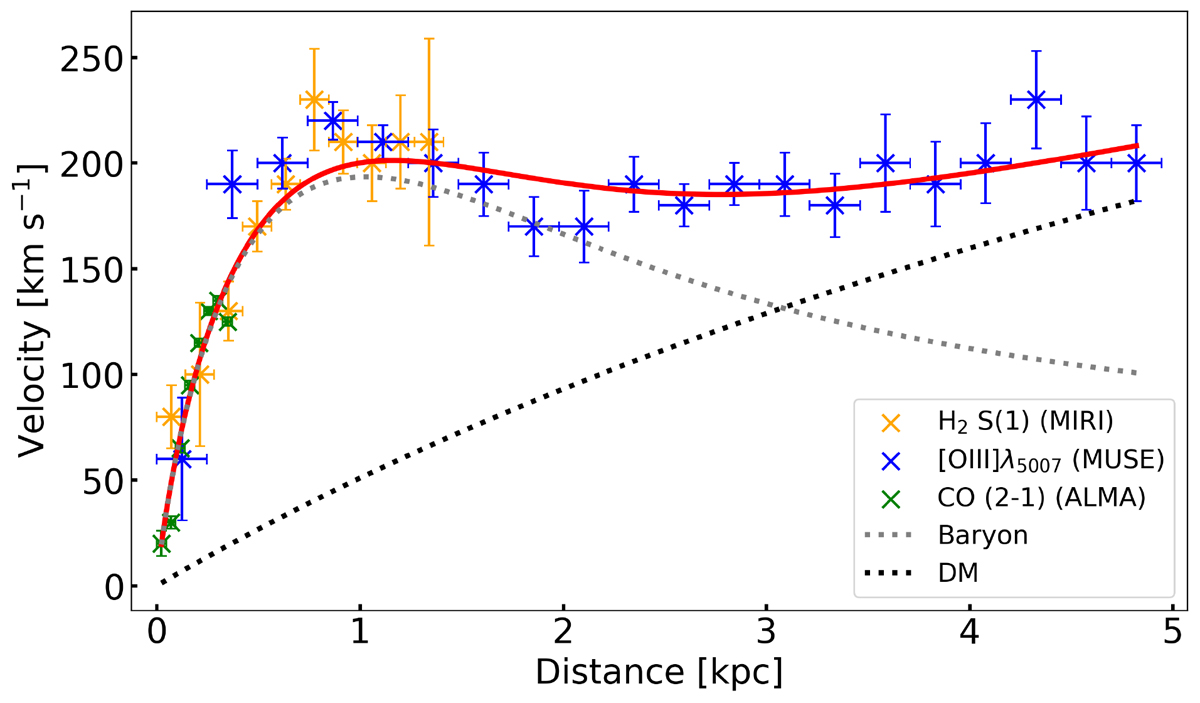
NGC 424 rotation curve inferred with MOKA3D using the H2S(1) (orange) and CO (2-1) (green) emission, and the narrow component of the [O III] (blue) emission line, from MIRI/MRS, ALMA, and MUSE, respectively. The rotation curve obtained fitting the narrow component of the [Ne III] shown in Fig. 4 is not reported, as the trend is similar to the H2S(1). The dotted black and grey curves represent the best-fit velocity profile of the DM (Eq. (3)) and baryonic matter (Eq. (2)), respectively. The total best-fit profile is shown as a solid red curve. The averaged rotating velocity and inclination values are listed in Table 2. Details on the MOKA3D disc model are discussed in Sect. 4.1.
Current usage metrics show cumulative count of Article Views (full-text article views including HTML views, PDF and ePub downloads, according to the available data) and Abstracts Views on Vision4Press platform.
Data correspond to usage on the plateform after 2015. The current usage metrics is available 48-96 hours after online publication and is updated daily on week days.
Initial download of the metrics may take a while.