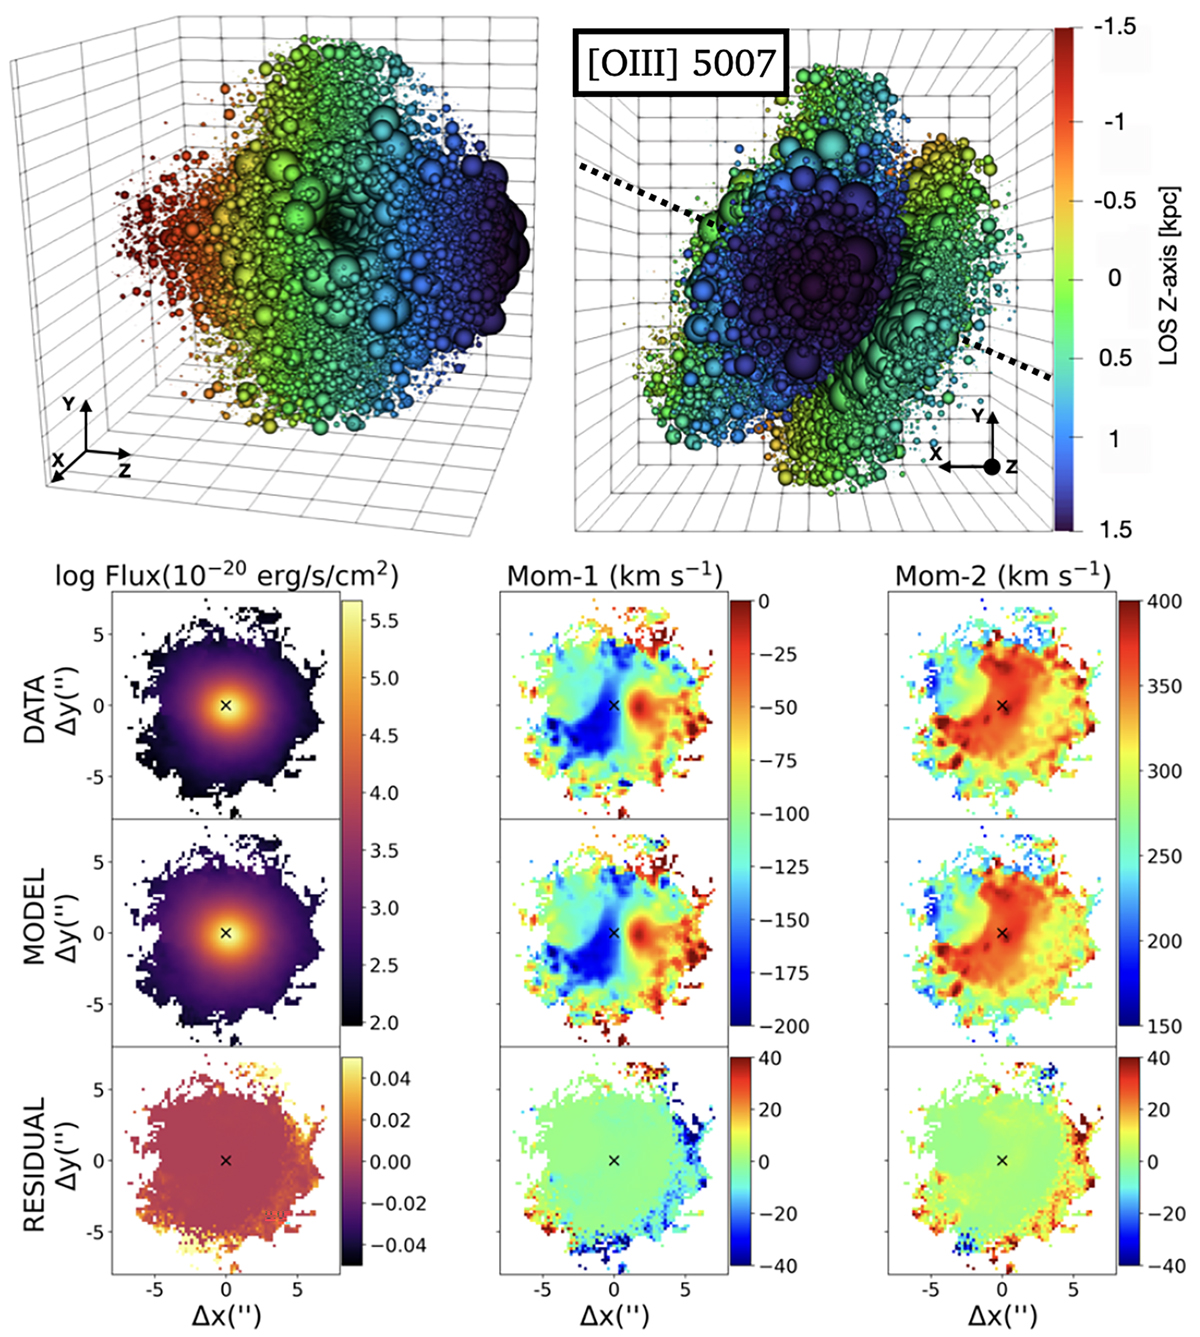
Fig. 6.
Download original image
MOKA3D best-fit model for the ionised outflow traced by the broad component of the [O III] from MUSE data. Top panels: 3D reconstruction of the ionised gas clouds colour-coded based on their position with respect to the plane of the sky and observed along the outflow axis (left, i.e. as if the conical outflow axis coincide with the line of sight of the observed) and along the line of sight (right). The XY represents the plane of the sky, while the Z is the LOS. The dotted black lines in the right panel show the bi-conical outflow axis direction. According to the colourbar, blue and red clouds are blueshifted and redshifted, respectively. The bubble size is representative of the intrinsic cloud flux. Bottom panels: Data (top), MOKA3D best-fit (middle) and residual (bottom) moment maps, i.e. the integrated flux, the LOS velocity, and velocity dispersion maps. The residual maps are obtained by subtracting the model from the observed moment maps. Maps are masked at a S/N of 3. North is up and east is left.
Current usage metrics show cumulative count of Article Views (full-text article views including HTML views, PDF and ePub downloads, according to the available data) and Abstracts Views on Vision4Press platform.
Data correspond to usage on the plateform after 2015. The current usage metrics is available 48-96 hours after online publication and is updated daily on week days.
Initial download of the metrics may take a while.