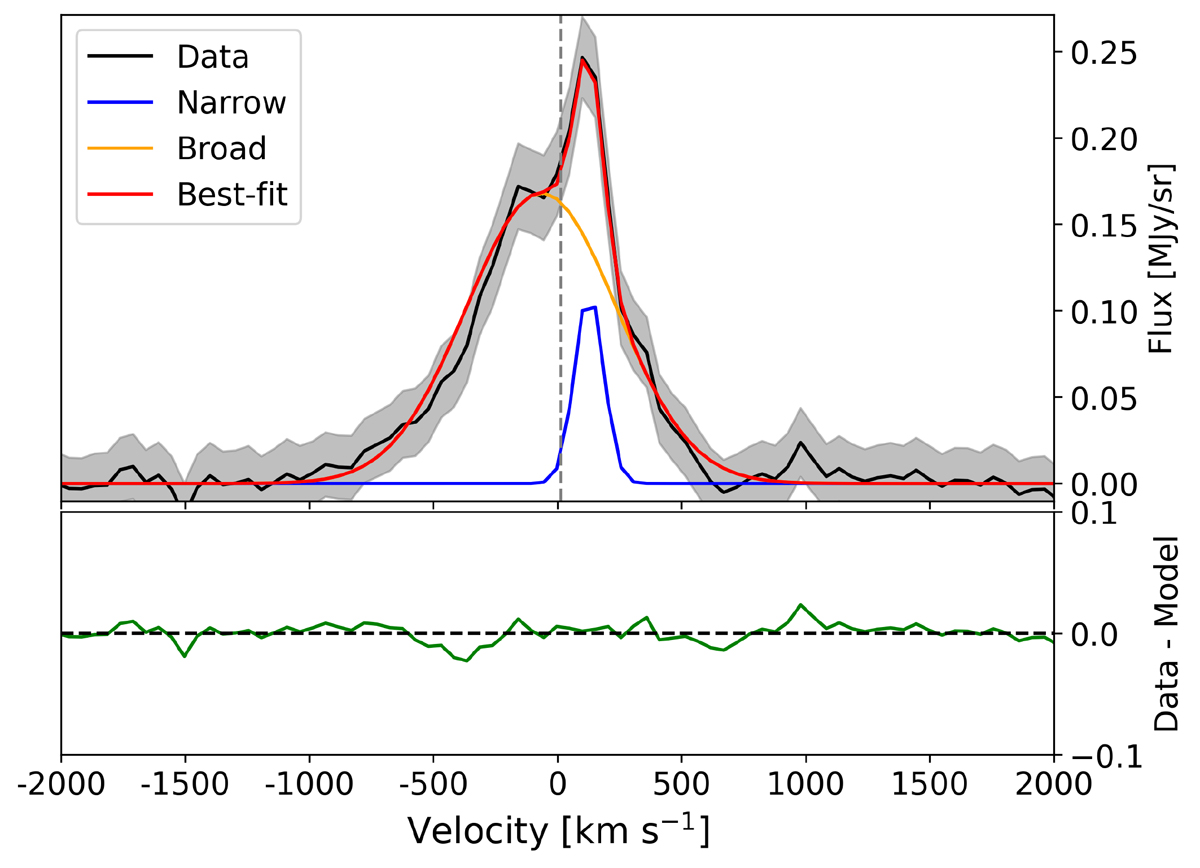
Fig. 8.
Download original image
Multi-Gaussian fit of the integrated [Ne V] emission line from the total MIRI/MRS Ch3 MEDIUM band. Data and total best-fit model are in black and red, respectively. The narrow and broad Gaussian components are shown as solid blue and orange lines, respectively. The bottom panel shows the residuals in green. The vertical dashed grey line marks the rest-frame wavelength of the [Ne V] transition.
Current usage metrics show cumulative count of Article Views (full-text article views including HTML views, PDF and ePub downloads, according to the available data) and Abstracts Views on Vision4Press platform.
Data correspond to usage on the plateform after 2015. The current usage metrics is available 48-96 hours after online publication and is updated daily on week days.
Initial download of the metrics may take a while.