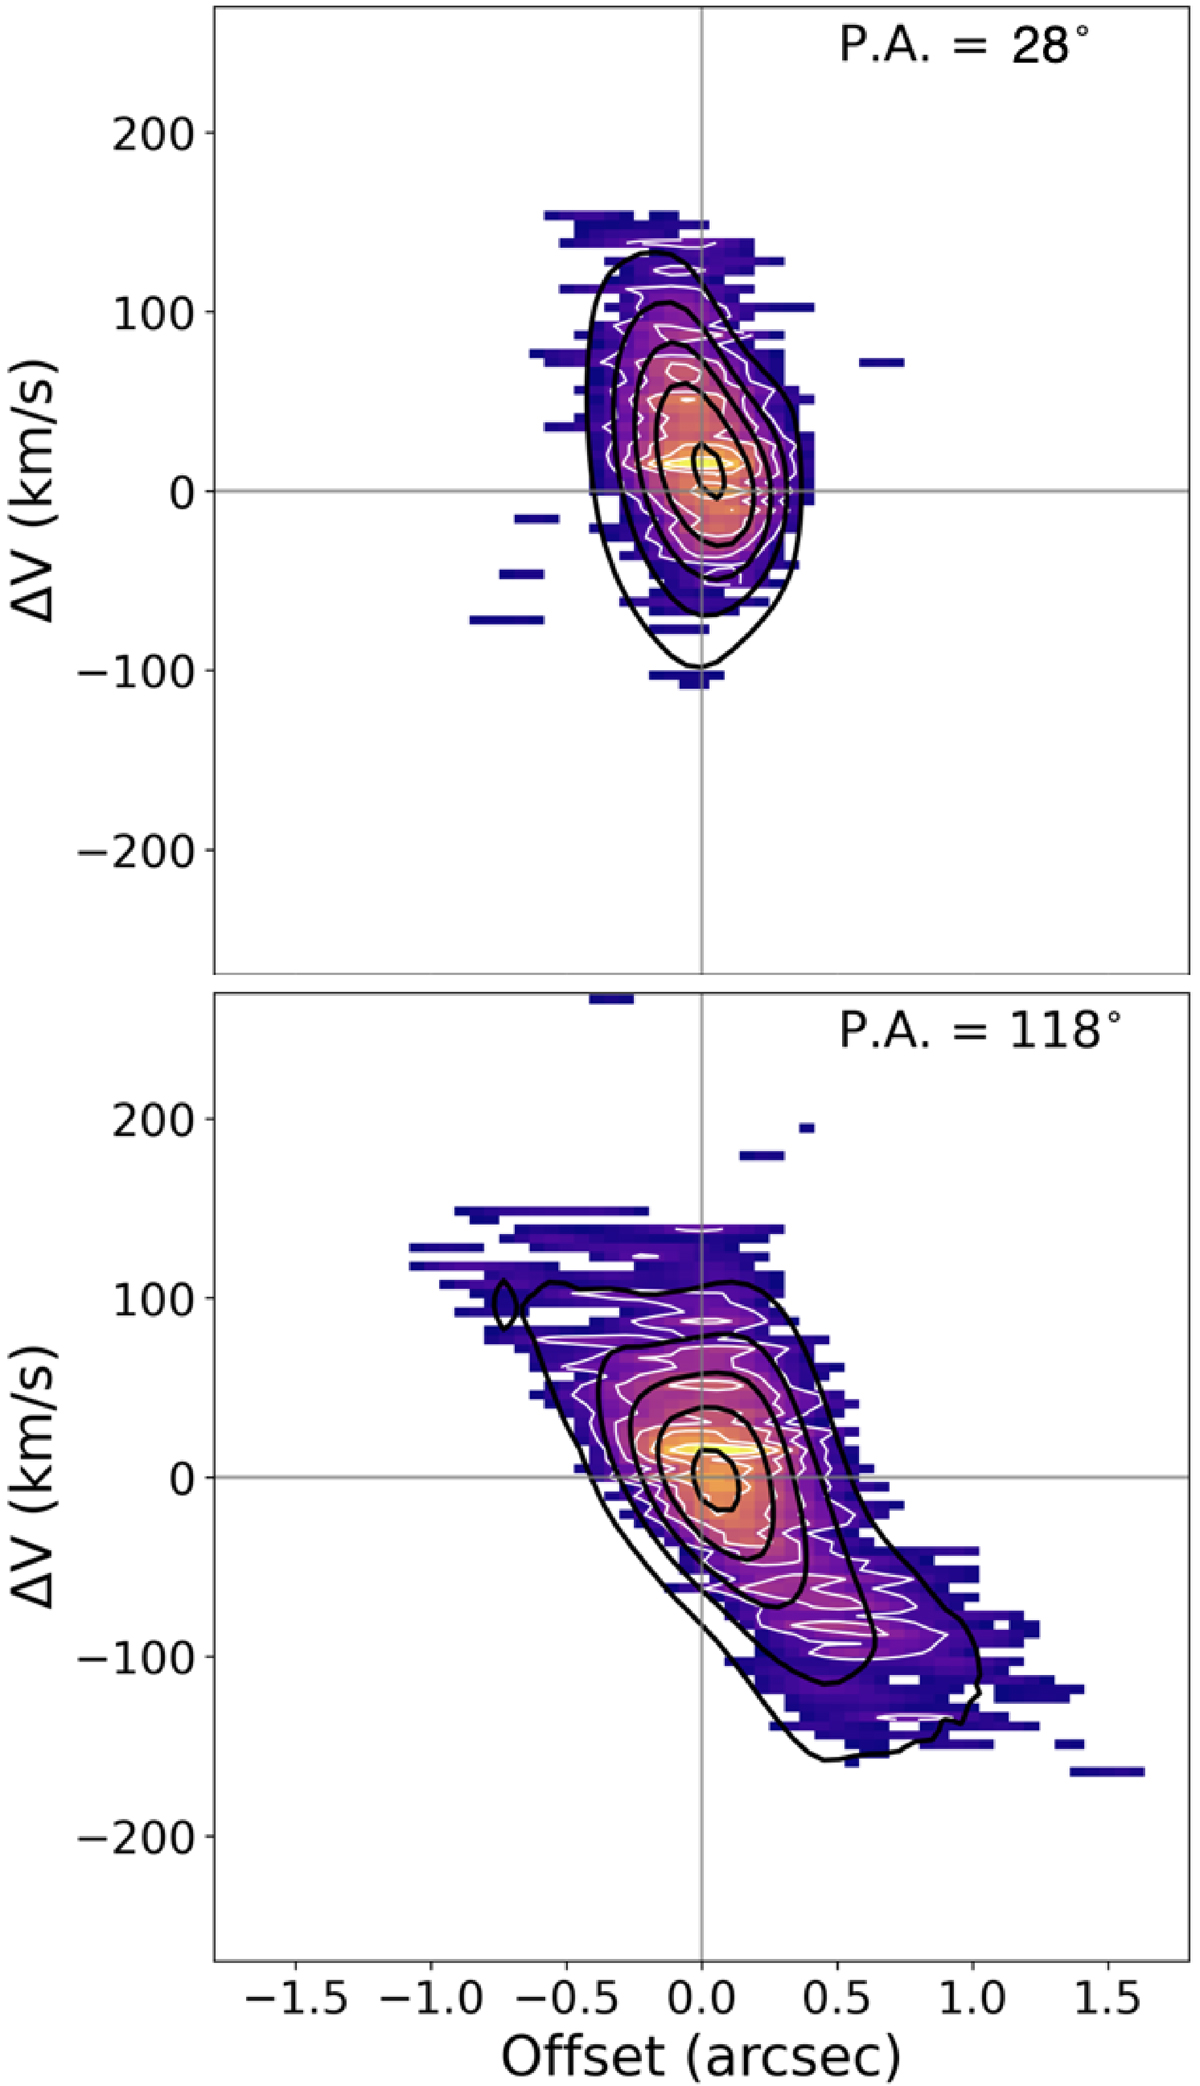
Fig. 9.
Download original image
Position-velocity diagrams extracted from a slit of width 0.8″ along the NGC 424 CO (2-1) kinematic minor axis (top panel, PA = 28°, see Table 2) and major axis (bottom panel, PA = 118°). CO (2-1) emission is masked at S/N ≤ 3. White contours correspond to arbitrary levels of the observed emission. Black contours correspond to arbitrary levels extracted from the best-fit model cube obtained with MOKA3D shown in Fig. C.3 and described in Sect. 4.1.
Current usage metrics show cumulative count of Article Views (full-text article views including HTML views, PDF and ePub downloads, according to the available data) and Abstracts Views on Vision4Press platform.
Data correspond to usage on the plateform after 2015. The current usage metrics is available 48-96 hours after online publication and is updated daily on week days.
Initial download of the metrics may take a while.