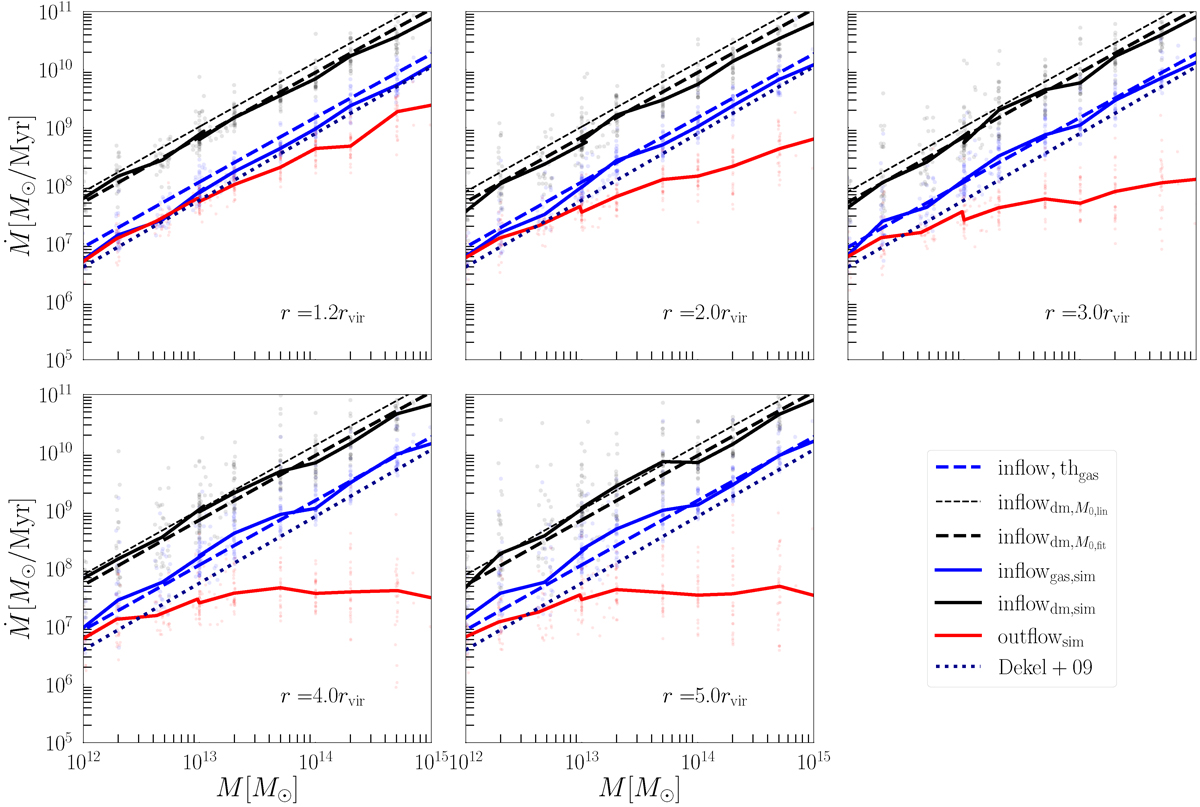
Fig. 3.
Download original image
Comparison of the total inflow (black and blue lines for DM and gas respectively) and outflow (red line for gas only) in the Magneticum simulation and the van den Bosch (2002) model (dashed black lines, thin for the linearly extrapolated M0, nofit; bold for the fit M0, fit). The inflow component is decomposed into a DM accretion flow and a baryonic accretion flow using the baryon fraction and the Andreon (2010) model to compensate for the increasing stellar component at low masses. Additionally, we show the gas accretion model presented by Dekel et al. (2009) as the dark blue dotted line. All flows are shown at 1.2, 2, 3, 4, and 5 virial radii (different panels).
Current usage metrics show cumulative count of Article Views (full-text article views including HTML views, PDF and ePub downloads, according to the available data) and Abstracts Views on Vision4Press platform.
Data correspond to usage on the plateform after 2015. The current usage metrics is available 48-96 hours after online publication and is updated daily on week days.
Initial download of the metrics may take a while.