| Issue |
A&A
Volume 701, September 2025
|
|
|---|---|---|
| Article Number | A192 | |
| Number of page(s) | 19 | |
| Section | Extragalactic astronomy | |
| DOI | https://doi.org/10.1051/0004-6361/202554804 | |
| Published online | 12 September 2025 | |
Go with the flow: The self-similar and non-linear behaviour of large-scale in- and outflows and the impact of accretion shocks from galaxies to galaxy clusters
1
Universitäts-Sternwarte, Fakultät für Physik, Ludwig-Maximilians Universität München, Scheinerstr.1, 81679 München, Germany
2
Max-Planck-Institute for Astrophysics, Karl-Schwarzschild-Str. 1, 85748 Garching, Germany
⋆ Corresponding author: This email address is being protected from spambots. You need JavaScript enabled to view it.
Received:
27
March
2025
Accepted:
7
July
2025
Abstract
Based on the scale-free nature of gravity, the structure in the Universe is expected to be self-similar on large scales. However, this self-similarity eventually breaks down due to small-scale gas physics such as star formation, active galactic nucleus (AGN) and stellar feedback, and non-linear effects gaining importance relative to linear structure formation. In this work, we investigate the large-scale matter flows that connect collapsed structures to their cosmic environments. Specifically, we focus on their agreement with self-similarity in various properties. For this purpose we used the full power of the hydrodynamical cosmological simulation suite Magneticum Pathfinder to precisely calculate the instantaneous inflow and outflow rates of structures on a large range of masses and redshifts. We find a striking self-similarity across the whole mass range and through time that only breaks down in the outflowing regime due to the different outflow driving mechanisms for galaxies versus galaxy clusters. We additionally performed a geometrical analysis of the patterns of inflow versus outflow to demonstrate how the inflows organise into anisotropic filaments driven by the tidal distortions of the environment, while the outflows are fairly isotropic due to their thermal nature. This also manifests in the differences in the thermal and chemical properties of the gas in the inflowing and outflowing component: While the inflowing gas is pristine and colder, encountering the accretion shock surfaces and entering the influence region of AGN and stellar feedback heats the gas up into a diffuse metal-enriched hot atmosphere. Overall the differences between outflowing and infalling gas are enhanced at the galaxy cluster scale compared to the galaxy scale due to the strong accretion shocks that reach out to large radii for these objects. An individual study of the gas motions in the outskirts of one of the most massive clusters in the simulations we carried out demonstrates these results to greater detail: Gas found in the outer (r > 1.2rvir) hot atmosphere at z = 0 falls in and is completely enriched early in the assembly process before being shock heated and expanding.
Key words: methods: numerical / galaxies: clusters: general / galaxies: groups: general / galaxies: statistics / large-scale structure of Universe
© The Authors 2025
 Open Access article, published by EDP Sciences, under the terms of the Creative Commons Attribution License (https://creativecommons.org/licenses/by/4.0), which permits unrestricted use, distribution, and reproduction in any medium, provided the original work is properly cited.
This article is published in open access under the Subscribe to Open model. This email address is being protected from spambots. You need JavaScript enabled to view it. to support open access publication.
1. Introduction
Obtaining a detailed understanding of the multi-scalar process of structure formation remains a key objective for modern cosmology and astrophysics. Since the notion of the inter-connectivity of the large-scale cosmic web was first conceived by Zeldovich in his seminal paper (Zel’dovich 1970), it has become ever more clear that the large-scale assembly of matter into a complex web of filaments, sheets, and nodes has consequences that proliferate well into the regime of non-linear structure formation and evolution in the galaxy regime (e.g. Papovich et al. 2018; Castignani et al. 2022). The filamentary and smooth gas flows in the vicinity of galaxy clusters and galactic haloes are governed by a complex combination of the gravitational environment they arise in and the internal gas physics that predominantly drive the outflows. A comprehensive overview of the complex physics in the outskirts of galaxy clusters has been presented by Walker et al. (2019).
On the galaxy scale, the make up of the large-scale environment is widely assumed to be a crucial factor in its star formation history and possible quenching as well as in the galaxy’s dynamical evolution (Galárraga-Espinosa et al. 2023). If the gravitational Universe is truly self-similar and the morphological differences at small scales arise purely from the increased importance of baryonic processes at smaller scales, the configuration of the gas and dark matter flow fields around galaxy clusters and galaxies must bear some residual resemblance in global properties, albeit scaled by the different gravitational energies involved. The outskirts of (quasi-)virialised structures, where infalling gas and smaller structures encounter the thermalised medium of the already assembled larger structure for the first time, are a critical test bed for our understanding of how these structures form and accrete mass over time.
The hot components of the intra-cluster medium (ICM) in the outer regions of galaxy clusters and the multi-phase circum-galactic medium (CGM) have been the focus of recent large observational (e.g. Gatkine et al. 2019; Gatuzz et al. 2023) and theoretical (e.g. Churazov et al. 2023; Bogdán et al. 2023) efforts.
In the standard self-similar assembly picture, the radius at which the in-falling gas is shock-heated by the already virialised atmosphere (accretion shock radius, rsh) and the apoapsis of the first-infall orbit of dark matter (splash-back radius, rsp) are generally expected to coincide (Shi 2016; Dekel & Birnboim 2006). However, recent numerical simulations have demonstrated that encounters of merger-driven shocks with the accretion shock and the resulting merger-accelerated shock (MA-shock) can drive baryonic shocks out to multiple virial radii in galaxy clusters far exceeding rsp (Zhang et al. 2020) and create complex non-spherical baryonic boundaries, with gas properties rapidly changing across these surfaces.
The CGM has a key part in understanding how galaxies regulate their star formation in a complex interplay of large-scale gas accretion, cooling flows from the cold phase CGM, and thermal feedback from star formation and active galactic nuclei (AGNs) (Yu et al. 2021; Stuber et al. 2021; Hogarth et al. 2021). The balance between pristine inflowing gas from the cosmic web feeding the star formation in galaxies and outflowing gas heated and enriched by feedback caused by the star forming activity and the central AGNs is still not fully understood. Nevertheless, it is crucial for understanding the evolution of galaxies and their properties through cosmic time.
A holistic theoretical understanding of structure formation and how collapsed structures are connected to their environment is, in general, crucial in the exploration and interpretation of the increasingly precise X-ray and Sunyaev-Zeldovic (SZ) observations of the present and near future. A better understanding of the ICM specifically and its complex non-thermal physics, such as clumping, bulk flows, and magnetic fields, is critical for improving mass estimates obtained from X-ray observations for cosmology. These non-thermal processes can introduce significant biases when assuming hydrostatic equilibrium to calculate masses. This can significantly impact the constraining power of cluster masses on cosmological parameters (Salvati et al. 2019; Lebeau et al. 2024a). Additionally, with regard to galaxy formation, a better understanding of the assembly of structures can aid in interpreting the highly resolved observations of inflows, outflows, and feedback bubbles now resolved in many galaxy observations (Watkins et al. 2023).
From a purely gravitational perspective, structure formation is assumed to be self-similar; that is, structures assemble the same way at all scales, owing to the scale-invariant nature of gravity. Therefore, it is the deviation from self-similarity that encodes interesting information on the complex baryonic processes that set the evolution of massive and less massive haloes apart. Balancing the reproduction of observed CGM and ICM properties simultaneously poses a formidable challenge to numerical simulations. Nevertheless, it is integral to their predictive power. This work aims to tackle the mass assembly of organised structures in the Universe from a multi-scalar perspective and to provide insights on the interaction of physical processes separated by several orders of magnitude. To this end, we investigated the mass flows in the outskirts of objects from galaxy (group) to cluster masses and analysed their gravitational and thermodynamical properties in the framework of a state-of-the-art hydrodynamical cosmologicalsimulation.
This paper is structured as follows: In Sec:Methods we introduce the numerical and theoretical methods we used to compute the flow fields in the Magneticum simulations and introduce the sample of haloes we applied these methods to. In Sec:Flows we discuss the accretion flows and outflows across the full mass range as well as their geometric properties. We then connect these flows to the entropic structure of the outskirt gas and specifically to the shocks in Sec:Shocks. Additionally we follow accreting gas particles in the outskirts of a massive cluster as they encounter those shocks and study their thermal and chemical properties. Finally, in Sec:Phase we discuss the phase properties of infalling and outflowing gas across the whole mass range in light of the findings of the preceding case study.
2. Methods
2.1. Simulations
We used the Magneticum Pathfinder suite of simulations1 which features a large selection of simulation volumes and resolutions (Dolag et al. 2025). All Magneticum Pathfinder simulations were performed with an updated version of the parallel cosmological Tree-PM code GADGET-2 (Springel 2005), namely P-GADGET3. To simulate the hydrodynamics, a modified smoothed-particle hydrodynamics (SPH) scheme was employed, with modifications such as improved thermal conduction (Dolag et al. 2004) and a low-viscosity formulation of SPH (Dolag et al. 2005a; Beck et al. 2016) in order to improve the modelling of ICM physics. Subgrid physics include metal dependent cooling, star formation and detailed treatment of stellar evolution (Tornatore et al. 2004, 2007) with supernova driven winds (Springel & Hernquist 2003), black hole growth and feedback from AGNs (Springel et al. 2005; Fabjan et al. 2010; Hirschmann et al. 2014).
Magneticum Pathfinder offers a number of different simulation runs, varying in size and resolution (and implemented physics). For the purpose of this work we used the largest high-resolution box (2 × 28803 particles), Box2b/hr. Past studies of galaxy cluster physics in this box include (but are not limited to): Studies of galaxy cluster substructures (Kimmig et al. 2023), studies of older, low-surface brightness galaxy clusters (Ragagnin et al. 2022), galaxy populations and star formation quenching due to cluster environments (Lotz et al. 2019, 2021) and predictions for soft X-ray excess emissions from the outskirts of galaxy clusters and the filamentary warm-hot intergalactic medium (WHIM) (Churazov et al. 2023). The evolution of protoclusters from z = 4 to the present day was investigated by (Remus et al. 2023). Additionally, a smaller box with higher resolution, Box4/uhr, was used to explore the lower end of the mass scale. This box has been primarily employed in galaxy studies such as global angular momentum properties (Teklu et al. 2015) and accreted (Remus & Forbes 2022) and baryonic (Harris et al. 2020) mass fractions of galaxies. Most relevantly for this work, it has recently been used to study the connection between star formation and gas accretion from the cosmic web (Fortuné et al. 2025) The cosmological parameters of the runs used are: h = 0.7, Ωm = 0.272, ΩΛ = 0.728, σ8 = 0.809, n = 0.963 consistent with the WMAP-7 cosmology (Komatsu et al. 2011).
2.2. Identifying the systems
GADGET3 includes an on-the-fly structure finding toolkit SUBFIND (Springel et al. 2001) with modifications to the substructure identification (Dolag et al. 2009), which creates detailed friends-of-friends based catalogues of clusters and sub-cluster child structures (that is galaxies). We sampled a catalogue of 29 × 11 = 319 randomly selected haloes in 11 logarithmic mass bins from 1012 − 1015 M⊙. The logarithmic width of each bin was was selected to ensure that at least 29 objects existed in each mass bin while keeping the width as small as possible2. We connect Box2b/hr and Box4/uhr at the 1013 M⊙ mass bin, where Box2b/hr still has enough resolution to resolve the haloes sufficiently and Box4/uhr has enough haloes to build a mass bin with a sufficiently small mass spread. (Dolag et al. 2025) show the resolutions to converge in the most relevant scaling relations for galaxies and clusters indicating that this mixing of resolutions is justified.
When selecting haloes at different timesteps, we did not trace individual haloes back in time but sampled new bins at each redshift, keeping the associated bin mass and not its constituents constant. The selected haloes are exclusively selected from the field, that is they are not bound to another, larger halo at some scale. This selection specifically excludes galaxies and groups evolving in a cluster environment, which are not the focus of this paper.
2.3. Reconstructing the peculiar mass flow from simulation data
The flow through a surface given a continuous velocity field v(x) can be generally computed by either integrating its divergence over the enclosed volume or via the Gaussian theorem by
 (1)
(1)
From a numerical perspective, the latter method is the more sensible (integrating over a volume, scaling with r3, versus a surface, with r2 scaling). The largest haloes in the sample reach several megaparsecs in virial radius. In other words, they reach scales where the expansion of the background cosmology becomes relevant, and therefore, we use peculiar velocities throughout this work. In SPH the gas discretisation is based on representative point particles that are smoothed over a volume of space with a density dependent kernel. To accurately model the gas flow given a set of gas particles it is therefore necessary to take into account the geometry and smoothing lengths of the kernels with the advantage that SPH will provide a continuous gas velocity field without artificial clumpiness. This ensures that there are no holes in the density/velocity field due to the SPH particles’ clustering leaving empty pixels, which would affect the computation of the geometrical properties of the flow fields in Sec:Flows. To obtain a similarly smooth velocity field for the dark matter component, equivalent smoothing lengths are computed in post-processing for this species by calculating a weighted mean density at each particle position using a simple neighbour tree.
2.4. Geometry
Because dark matter haloes can to first order be considered as approximately spherically symmetric (deviations from this assumption with regard to the matter configuration in the outskirts are discussed in Section 3.3) for the purpose of this investigation, we compute the flow through spherical shells. We set up the computation of the inflow and outflow rates to be at spherical surfaces of r ∈ [1.2, 1.4, …, 5.0]×rvir. The peculiar particle velocities were corrected by subtracting the centre of mass motion of the main halo the shells are centered on.
2.5. Flowmaps
We used the program SMAC (Dolag et al. 2005b) to generate the flow maps. Our custom version of this post-processing software – which adds a slice-based computation of the quantities for flow computation as opposed to the standard radial binning method – uses a healpix (Gorski et al. 2005) based tessellation of the surface to compute the SPH-based gas density at every pixel of the spherical shell. This density is calculated based on the contribution of each particle to the pixel:
 (2)
(2)
where αi is a geometry factor encoding the overlap of the particle with the pixel3, ρi is the nearest-neighbour density and w is the kernel function. We used the commonly employed cubic spline kernel for all SMAC calculations, where
 (3)
(3)
where  and rhsml, the neighbour-density based smoothing length is a simulation output. The net flow through the i-th pixel is then the sum over all particle velocity contributions to that pixel, weighted with the respective particle density contribution. The total net flow is simply the sum over all pixels. For each net flow map we also generated pure inflow and pure outflow maps in order to identify the regions of in- and outflow and analyse the components separately. Additionally, temperature and metallicity weight maps are generated in order to select for hot stream components and processed matter streams. Here the metallicity of a particle is calculated as the mass fraction sum of all elements heavier (Z) than helium (Y) divided by the particles hydrogen mass (X) mZ/mH = (1 − X − Y)/X. We then converted this value to solar metallicity, assuming the mass fractions from Wiersma et al. (2009).
2.6. Discerning between inflows and outflows
To identify regions of inflow and outflow, we used two approaches that are outlined in the following. These approaches amount to dividing the map by pixels and by particles.
2.6.1. Pixel-based philosophy
Whenever referred to as pixel-based flows, pixels are selected by the projection of the mass-weighted net velocity vector onto the radial direction
 (4)
(4)
through each pixel, where vi is obtained with the kernel (and geometry)-weighted sum over all particle contributions in the pixel and  is the local normal radius vector. This is useful for determining the spatial configuration of the vector field and selecting inflow- and outflow-dominated pixels, respectively.
2.6.2. Particle-based philosophy
The global quantities are computed by summing up particles with positive and negative radial velocity separately, generating pure inflow and pure outflow maps.
2.7. Theoretical accretion model
The fundamental theory of hierarchical structure formation can provide a theoretical first order estimate of the accretion flows one would expect in the vicinity of a halo with given mass. This work uses the relation for the universal mass accretion history (MAH) found by van den Bosch (2002) to compute a theoretical relationship between the halo mass and the expected accretion rate onto a halo of the given mass. Based on the excursion set extension of the standard Press-Schechter theory, they constructed randomly sampled mass accretion histories that are fit by the universal relation
![Mathematical equation: $$ \begin{aligned} \log \langle \Psi (M_{0},z) \rangle =-0.301\bigg [\frac{\log (1+z)}{\log (1+z_f)}\bigg ]^\nu , \end{aligned} $$](/articles/aa/full_html/2025/09/aa54804-25/aa54804-25-eq10.gif) (5)
(5)
where M0 is the mass of the halo today (at z = 0) and Ψ is the MAH (ratio of M to M0) as a function of M0 and redshift. The mass accretion rate can then be obtained by computing the derivative of this MAH with regard to time:
 (6)
(6)
The parameters zf and ν are free fitting parameters in this model, but van den Bosch (2002) offers a recipe to directly compute them from cosmology and mass scale. Since from a simulation perspective all information about the cosmology is present, this prescription is used to calculate the curve. It should be noted that the van den Bosch (2002) approach is a backwards one: It calculates the MAH starting from the properties of the haloes today and reconstructs the assembly working towards higher redshifts. To compare the inflow of a general mass bin to the theoretical relation, we therefore extrapolated the bin mass at z = 0.25 to an expected present-day mass using the linear growth factor
 (7)
(7)
In this work D0 = D(z = 0) is calculated using the approximate formula found by Carroll et al. (1992) for simplicity:
![Mathematical equation: $$ \begin{aligned} g(\Omega _\Lambda ,\Omega _M) = D/a\approx \frac{5}{2}\Omega _M\left[\Omega _M^{4/7}-\Omega _\Lambda +\left(1+\frac{\Omega _M}{2}\right)\left(1+\frac{\Omega _\Lambda }{70}\right)\right]^{-1}. \end{aligned} $$](/articles/aa/full_html/2025/09/aa54804-25/aa54804-25-eq13.gif) (8)
(8)
We also employed an alternative approach where the relationship between the halo mass at z = 0.25 and the halo mass today is left as a free-fitting parameter, that is parametrising
 (9)
(9)
The two methods are compared in the following section.
3. Characterising the mass flows in the outskirts of Magneticum haloes
In most conventional structure formation models, haloes are assumed to grow self-similarly and bottom-up with the additional assumption of spherical collapse as the main mechanism in the non-linear growth regime. Examples for this are the earlier described semi analytical MAH model from van den Bosch (2002) as well as the model from Dekel et al. (2009), both of which are built on the extended Press-Schechter formalism (EPS). However, the now well-studied cosmic web is already a manifestation of asphericities and non-linear effects arising in the large-scale regime (Hidding et al. 2014), posing the questions whether accretion models based on sphericity and self-similarity hold in realistic cosmic environments such as fully hydrodynamical cosmological simulations, and whether self-similarity itself might already be broken at the large-scale flow level. Figure 1 shows the density, velocity, temperature and metallicity maps resulting from the scheme described in Section 2.5 for an example halo with Mvir = 1.61 × 10¹⁵ M⊙ (cluster 5). To illustrate the correlation between density and flow, temperature and metallicity, density contours in each panel indicate the regions with mean density and a factor of 3 and 8 times the mean density in the respective maps. As can clearly be seen, we find dense regions to be dominated by inflow and lower temperature gas indicating a cold filamentary inflow. In contrast underdense regions of higher temperature indicate an isotropic outflow most effectively expanding into underdense regions. To investigate this more closely, we split the maps into their inflowing and outflowing components and analyse them separately over a large range of radii and halo masses. For this we computed the instantaneous in- and outflow at five spherical radii (r ∈ [1.2, 2.0, 3.0, 4.0, 5.0]×rvir) of increasing radius. An example of such a computation can be seen in Fig. 2 for two galaxy clusters from the Mvir > 1015 M⊙ bin, the 5-th (left column, also shown in Fig. 1) and 20-th (right column) most massive cluster in Box2b/hr respectively (hereafter referred to as cluster 5 and cluster 20) for the full radial range. As can be seen, the inflow (blue colour) follows the higher density regions radially, while the outflows (red colour) are distributed more isotropically across the underdense regions. For both haloes, the outflowing component fades at larger radii.
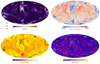 |
Fig. 1. Four fields (density, radial velocity, temperature, and metallicity) interpolated on the spherical shells just outside the virial surface (r = 1.2rvir) shown for an exemplary cluster from the highest mass bin (1015 M⊙). The contours indicate the |


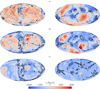 |
Fig. 2. Exemplary total mass flow map generated with SMAC (Dolag et al. 2005b) for cluster 5 (left column) and cluster 20 (right column) in the sample. Red marks the outflow-dominated pixels, while the inflow-dominated pixels are blue. Contours again mark the overdensity at the 1-δ and the 8-δ level. (a) 1.2rvir. (b) 2.0rvir. (c) 3.0rvir. |
3.1. Accretion
To obtain a more statistical view of these observations, we computed the surface based in- and outflows for the complete sample (from Mvir = 1012 − 1015 M⊙). Figure 3 shows the flow rates versus halo mass at the five radial Figure 3. The blue line in Fig. 3 shows the surface-based total gas inflow of the sample while the black solid line shows the DM accretion. For the gas inflow, we find an overall trend of rates increasing with halo mass that is consistent across the complete radial range from 1.2 to 5.0rvir. This clearly demonstrates gas accretion to be a self-similar process from Milky Way-mass haloes to the most massive galaxy clusters, implicating halo internal processes to be the driver of the break in self-similarity, not the accretion flows. The comparison of dark matter (DM) inflow rates with the theoretical curves obtained from nofit (dashed black) demonstrates an over-estimation of accretion from dark-matter-only linear theory relative to full hydrodynamics. The overall shape of the linear infall scaling relation is nonetheless recovered well from the simulations. Strikingly, leaving the uncertainty about final halo masses to a fitting parameter according to fit (dashed black) achieves an even better agreement between the DM infall relations, as the normalisation brings the curves to closer agreement with each other. This is remarkable when considering the simplicity of the underlying assumptions: The calculation of van den Bosch (2002) is based on a purely linear evolution of the DM density perturbation field, while the haloes considered here have significant amounts of gas and lie firmly in the non-linear regime. Additionally, as Fig. 2 shows, the infall is geometrically far from the spherical symmetry of the top-hat collapse model that the upcrossing thresholds of the excursion set formalism are obtained from (e.g. Navarro et al. 1997), but rather is organised into filamentary structures that dominate the overall accretion flow. Comparing the inflowing gas curves (blue) of Fig. 3 to the DM curves shows that even close to the virial surface of the halo the infalling gas is still tightly coupled to the DM accompanying it. Only upon encountering the pressure supported, hotter gas closer to the halo centre at the shock surfaces (for a further discussion on where these surfaces are located, see Sec:Shocks) that especially massive haloes drive in this region will this gas uncouple from the large-scale flow (Shi 2016). The impact of this heating on the accretion flow can be seen in comparing the theoretical gas accretion rate (dashed blue line), obtained by multiplying the DM inflow with the cosmic baryon fraction, to the measured gas flow across the five radial Fig. 3. Purely gravitationally (as derived from the accretion model) the expected gas accretion rate is higher then the actual accretion achieved taking hydrodynamics into account. From 1.2 − 2rvir, this discrepancy is consistent with mass, even though it is not present for the inflow computed with the model by Dekel et al. (2009). Beyond 3rvir the less massive haloes (M < 2 × 10¹³ M⊙) reach the theoretically predicted gas inflow rate, while the discrepancy in the high-mass Fig. 3 persists to larger radii. This effect is visible in both the DM and the gas component. However, as can be seen by the thin dashed line in Fig. 3, this discrepancy can be almost entirely attributed to the linear extrapolation, leading to an overshooting in the theoretical estimate. Leaving the scaling as a fitting parameter (as described in Sec:Methods) leads to much better agreement.
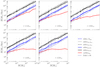 |
Fig. 3. Comparison of the total inflow (black and blue lines for DM and gas respectively) and outflow (red line for gas only) in the Magneticum simulation and the van den Bosch (2002) model (dashed black lines, thin for the linearly extrapolated M0, nofit; bold for the fit M0, fit). The inflow component is decomposed into a DM accretion flow and a baryonic accretion flow using the baryon fraction and the Andreon (2010) model to compensate for the increasing stellar component at low masses. Additionally, we show the gas accretion model presented by Dekel et al. (2009) as the dark blue dotted line. All flows are shown at 1.2, 2, 3, 4, and 5 virial radii (different panels). |
3.2. Outflow
There are two main channels that can drive outflowing motion in the outskirts of an assembling halo, namely the conversion of gravitational energy from mergers and accretion to thermal energy of the gas via virialisation processes and heating from AGNs and star formation in the galaxies present in the haloes. The outflowing component is shown in red in Fig. 3. In contrast to the accretion rate, the outflowing component flattens out with increasing radius, being almost completely flat at 5rvir, breaking the self-similarity. Figure 4 additionally shows the relative outflow strength (mass flow rate normalised to the halo mass) for each mass bin at the five radii. The breakdown of strong outflows at the high-mass end can be seen even more pronounced in this figure, especially at large radii.
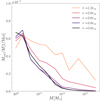 |
Fig. 4. Relative outflow strength (the outflow rate divided by the respective halo mass, |

This is most likely a manifestation of the different effectiveness of feedback processes at different scales. At galaxy scales, processes such as stellar feedback and AGN feedback can kick gas out to several virial radii, maintaining a high outflow rate to larger relative distances, while in galaxy clusters and massive groups the deeper potential well can balance out the impact of heating. We note that numerical simulations employing simplified AGN feedback schemes can additionally over-enhance the impact of the (in the case of Magneticum purely thermal) feedback at galaxy to group scales, which we will discuss further in Sec:Phase.
Because of the contrast between the thermal nature of the outflow and the gravitational nature of the inflow, one would also expect a difference in the spatial distribution of the two gas components with the outflows being more isotropically distributed than the inflows due to their thermal origin. The map-making scheme described in Sec:Methods provides the data to verify this for the numerically simulated haloes, which we will discuss in further detail in the following section.
3.3. Flow geometry
In Figure 2 we show the surface distribution of inflow- and outflow-dominated pixels for two example haloes. It is apparent that inflowing gas is generally more concentrated than outflowing gas, consistent with the picture of a filamentary inflow driven by gravity versus thermally driven outflows. To obtain a more statistical measure of the geometrical properties of the gas distribution (or any distribution of a scalar quantity) the flow field can be reduced to a power spectrum by computing its harmonic decomposition. Comparable techniques have been used in the past to identify preferred directions of infall for satellite galaxies (Libeskind et al. 2011), to measure the degree of filamentary to isotropic accretion in isolated cluster simulations (Vallés-Pérez et al. 2020), and to study the correlation of the 2D-azimuthal symmetries in gas and DM to various halo properties (Gouin et al. 2022). We calculated the aspherical excess on the sphere, following closely the approach by Gouin et al. (2022). This excess is given by the sum of all multipole moments higher than the monopole normalised to the monopole power, truncating the sum at the ninth order to ideally capture the large-scale anisotropic inflow modes:
 (10)
(10)
A more spherically homogeneous field has less power in the non-isotropic angular modes, thus lowering ζ with a perfectly homogenous inflow field having a ζ of 0. For a more complex inflow field the exact value of ζ will depend on the spatial configuration (for example filament thickness and alignment), so to disentangle the exact structure the full spectrum of the spherical harmonics is necessary. A more detailed study on this parameter, the Asphericity ζ will be presented by Seidel et al. (in prep.).
Figure 5 shows the distribution of the asphericity for each mass bin at 1.2rvir (left panel) and 2rvir (right panel). In agreement with expectations, the distribution of inflowing gas is consistently more aspherical than the outflowing component. Additionally, the inflow asphericity exhibits a wider spread between systems. This clearly demonstrates the different mechanisms at play for the in- and outflowing component. While gravity organises the inflows into filaments according to the local environment of a halo, thus exhibiting a greater variance, the thermal processes that drive the outflows are more isotropic in nature and thus show less variance between haloes in different environments. The stability of this discrepancy across the mass range indicates, that groups and galaxies are indeed also connected to filamentary flows, similar to their more massive counterparts. This reflects the fractal nature of the cosmic web (Gaite 2019), providing connectivity for galaxies and groups via low-mass filaments.
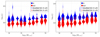 |
Fig. 5. Aspherical excess of the flows parametrised by the asphericity parameter ζ at 1.2rvir (left) and 2.0rvir (right) for the inflowing and outflowing components, respectively. The violins show the vertical distribution, while the black horizontal lines show the median for each bin. The bin present in both simulations (Box2b/hr and Box4/uhr) is plotted twice to indicate the transition in resolution. |
Only a slight positive mass trend is apparent, indicating that the flow geometry outside of the virial radius is similar across the mass scales. Especially the lack of a low-mass end enhancement is striking as this implies that the outflows generated by baryonic feedback processes do not disturb the homogeneity of the hot gas outside of the virial surface even for small groups. This result is remarkable because feedback strength in a galaxy varies on small spatial scales, so one would expect more power in the high-frequency modes in the low-mass Fig. 3, where these processes contribute more to the overall outflow. A potential reason for the missing signal here is the currently simplified sub-grid model for feedback in the Magneticum simulations with a distinct lack of directional kinetic feedback.
A discrepancy between the two simulation volumes can be seen at the mass bin with 1013 M⊙: In contrast to the mass flow rates, which are averaged over the entire spherical surface the asphericity is enhanced in the smaller, higher-resolution Box4/uhr. A possible explanation is that the highest mass bin of Box4/uhr by construction contains some of the largest collapsed haloes in the box, which tend to be very active and rather atypical in small volume cosmological simulations, so the bin value might simply not be representative for this mass bin. An additional possible factor is the difference of resolution, leading to a better resolved web structure around the haloes in the smaller Box4/uhr. This can be understood by considering how the total mass is split into discrete particles: In the higher-resolution box, particles have a smaller characteristic scale, which, when keeping the physical scale constant, will produce a fluctuation of the flow field with a smaller minimal scale than in the low-resolution case.
3.4. Redshift evolution of the measured flows
In the hierarchical picture of structure formation haloes form bottom-up with low-mass haloes forming early and then collapsing into larger structures at late times (Press & Schechter 1974). As the cosmic web assembles, we thus expect the accretion flow rates of our sample of isolated haloes to decrease with time overall. We consider the redshift evolution of the flows: Fig. 6 shows the inflow (left column) outflow (middle column) and the net accretion rate as a function of mass at different times, with the colour of the curves indicating the redshifts across all panels. We find that the inflow rates at all halo masses decrease self similarly with time. In contrast, the outflow is generally more stable over time than the inflow, showing an overall decrease by a factor of two to four versus a factor of five to eight for the inflow. Both flow modes vary mostly self-similarly across the entire mass range with decreasing redshift, conserving the slope of the flow-mass relationships. The consequence of relatively stronger outflows at the low-mass end, which was discussed in the previous section, can be seen in the rightmost panel: While all haloes experience a net inflow, its strength is proportional to halo mass, with the low-mass end exhibiting significantly lower net inflow than the massive clusters, which breaks the self-similarity in the net accretion rate. With decreasing redshift this relationship steepens, caused by a slight increase in the slope of the outflow-mass relationship, further highlighting the breakdown of self-similarity between the outflows in low and high-mass haloes. Cluster-size objects at late times seem to be able to compensate the relatively weaker impact of thermal feedback more effectively at late times, steepening the outflow massrelationship.
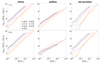 |
Fig. 6. Redshift evolution of inflow, outflow, and net flow (inflow − outflow) at 1.2rvir (top row) and at 2.0rvir (bottom row). The bin masses (x-axis) are identical to the ones used in Fig. 3. The colours indicate the redshift of the curve. |
One possible explanation for this is that at low redshifts, most cluster-sized objects have undergone a massive merger through their assembly history and thus also have more energy injected into their outskirts and are able to drive merger shocks or even MAH shock fronts where the gas is heated rapidly (Zhang et al. 2020). As this transition between feedback driven and shock propagation driven outflows (where the latter are sourced by gravitational heating and mergers) also impacts the chemical evolution of the gas, in the following section we analyse the shocks more closely before the interacting thermal and chemical properties of the pre- and post-shock gas areconsidered.
4. Shocks in the outskirts of Magneticum haloes
Shocks play a central role in the formation of structures and the fragmentation of matter therein. In the simplest picture of a collapsing gas cloud (e.g. Rees & Ostriker 1977) with even slight deviations from a perfectly spherical collapse, shock heating thermalises the kinetic energy and critically influences further mass accretion: Depending on the ratio of the (radiative) cooling time to the infall time  , collapse might either continue in free-fall if cooling is efficient enough to diminish the pressure support from the heated gas (case I, tcool < tdyn) or enter a quasi-static contraction stage with a hot atmosphere (case II, tcool > tdyn) (Dekel et al. 2009). The distinction between these regimes is determined by the overall mass of the system, with the transitional regime traditionally in the range of Mvir = 1010 − 1012 M⊙ (Rees & Ostriker 1977). An important distinction between the two modes of accretion is the radius at which the shock stabilises. In the low-mass case (I) the stabilisation radius is deep inside the DM halo (rshock ≪ rvir) while more massive haloes are expected to have their accretion shocks stabilise on distances of the order of the virial radius or larger rshock ≥ rvir.
In the complex environment of non-linear structure formation the transition between the rapid-cooling and slow-cooling accretion channels, namely the shock position, is significantly impacted by additional factors: Denser gas is organised into filaments at inflow and thus cools more efficiently and penetrates further into the halo unaffected by the shock (Dekel et al. 2009). Furthermore, as previously mentioned, merger shocks interact with the accretion shocks (Zhang et al. 2020) in the outskirts of massive clusters. Additionally the energy injected by feedback plays a more important role at the low-mass end. This affects both the inflowing and the outflowing gas: The outflowing component is heated and can thus reach larger radii in the shallower potential of low-mass haloes. On the other hand feedback can also lead to a gentle heating of the infalling gas before being shocked (Murante et al. 2012), especially in low-mass haloes. Hydrodynamical cosmological simulations such as Magneticum therefore offer a unique laboratory to study the cluster shock dynamics in realistic environments and probe for the stability of simple mass-scaling arguments such as the one outlined above.
One cannot draw precise conclusions about the position of the shocks themselves from the flow fields alone. To assess the scale dependence of shock strength and position, we calculated the pseudo-entropy (K) given by Zhang et al. (2020) as
 (11)
(11)
averaged over radial shells across the complete sample, where usually an adiabatic index γ = 5/3 is assumed. Fig. 7 shows the entropy environment in a quadratic slice of 10rvir side length for halo 20 (1015 M⊙) and halo 5 (1015 M⊙) from Box2b/hr as well as halo 31 (1013 M⊙) and halo 538 (1012 M⊙) from Box4/uhr. Generally it can be seen from the bright entropy edges, where the entropy peaks before dropping off, that the accretion shocks stabilise at much larger relative radii for the group size and galactic haloes, aided by the shallower potential of these haloes and the thermal feedback. This can also be seen in Fig. 4: The outflow strength relative to the halo mass is almost monotonically decreasing as a function of mass at larger radii. In general, Fig. 7 demonstrates that the radial peaks of entropy serve as a simplified tracer of where the outer shock surfaces lie.
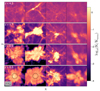 |
Fig. 7. Entropy evolution of a 1.3 × 10¹⁵ M⊙ mass non-cool-core cluster, a 1.6 × 10¹⁵ M⊙ cool-core cluster, a 1.6 × 10¹³ M⊙ size group, and a 0.91 × 10¹² M⊙ halo, from left to right. The black circle indicates the virial radius of each object. The box lengths are scaled to ten times the virial radius for the clusters and 40 times the virial radius for the groups or galaxies with a slice thickness of 1 Mpc/h for all images. |
We extended the radial profiles inwards to 0.6rvir in order to detect the entropy peaks if they are found at smaller halocentric distances. Figure 8 shows these radial entropy profiles for all haloes in the sample in absolute entropy (left column) and scaled to the entropy at the virial radius (right column). There is a clear evolution in the shape of these profiles with mass: The shocks (i.e. the entropy peaks) are smoothed out with decreasing mass of the central halo. For the haloes that exhibit an entropy peak within the probed radial range (up to 5rvir), it is generally broader and peaked at greater radii with decreasing mass. This is in line with the general finding of the so-called closure radius (i.e. the radius at which the baryon fraction reaches the cosmic mean value) to scale with halo mass, as observed across various simulations in the group/cluster regime (Angelinelli et al. 2023). Most of the haloes that show adistinguishable peak have it in the region between 2 − 4rvir. This is consistent with slow cooling accretion shocks and possibly additionally merger driven outwards shock propagation. To demonstrate this more quantitatively, Fig. 9 shows the radius of maximum entropy as a function of mass for our halo sample. We find a consistent trend of decreasing scaled radius of maximum entropy as a proxy for the approximate shock position with mass. A possible explanation is the relatively stronger potential the gas moves into these heavier haloes, allowing the hot post-shock gas to expand to relatively smaller radii overall. The general dynamics can be expected to be consistent across the total mass range. Therefore, we investigated the interaction of gas accretion and shocks specifically for a galaxy cluster from the highest mass bin.
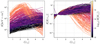 |
Fig. 8. Absolute, left panel, and scaled (K(r)/K(rvir), right panel, radial entropy profiles for all haloes in the sample. The virial mass is indicated by the colour of the curve. |
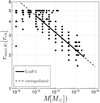 |
Fig. 9. Mass dependence of the radius of maximal entropy. The dots represent the individual haloes of the sample. The line shows a Linear fit in log-log space obtained from the haloes in the range where there is a clear entropy peak visible. The obtained parameters are t = 2.6193 ± 0.1157 and m = −0.1513 ± 0.0008 using a log(rmax(K)) = m × log(M/M⊙)+t model. The tight spacing of the dots along the x-axis reflects the mass spread of the Fig. 3, which we have optimised to be as small as possible (see Sec:Methods). |
5. Case study: Cluster 20
The thermal properties of the infalling and outflowing gas and how the two components (in- and outflow) interact at the shock boundaries is of critical importance for many processes internal to the halo, including replenishment of gas reservoirs for star formation in galaxies and the dynamical states of galaxy clusters. Because the jumps in the thermal properties of the gas are best resolved in the largest haloes (i.e. the shocks are the most pronounced), we focused on the gas properties in one of the biggest clusters in the Magneticum simulations, cluster 20, which was shown to be an excellent match for the observed galaxy cluster Abell 2744 by Kimmig et al. (2023). Specifically we focused on the infall and enrichment history of the gas that constitutes the outflowing component today. The abundance of heavy elements is routinely used in the literature to determine the origin and enrichment time of gas as well as the potential mechanisms to strip it from its host galaxies in cluster environments (e.g. Biffi et al. 2018). The velocity, temperature, and metallicity maps for this cluster are shown in Fig. s10. Consistent with expectations for an Abell 2744 counterpart, this cluster is fed by multiple filaments, mirroring the multiple mergers it is currently undergoing (Kimmig et al. 2023, see). In the following we therefore elucidate the impact of the thermal structure and accretion on the metallicity of the outflowing gas. In the final section, we assume a more global perspective on these gas properties.
The total metallicity of the gas found in the outskirts of clusters and its radial and azimuthal distribution can shed light on the overall dynamics of the infalling gas, that is where it is cold and dense enough to form stars that provide an influx of metals. This information can be further compounded by considering the enrichment type by analysing the mass ratios of different elements predominantly generated in different enrichment processes. One indicator for the type of enrichment and critically when it takes place is the ratio of oxygen to iron mass in the gas, as oxygen is the most common alpha element (Kobayashi et al. 2020). Early-type enrichment (i.e. enrichment from massive and short-lived stars on short timescales) is predominantly generated by core-collapse supernovae type II (e.g. Nomoto et al. 2013; Loewenstein 2006), which produce lighter (alpha) elements in greater abundance and thus increase the ratio of oxygen to iron mass. Significant late-type enrichment, which is generated by thermonuclear supernovae type Ia, lowers this ratio if the gas is in contact with the stellar component on longer timescales (de Plaa et al. 2007). Extending the particle tracing method introduced by Biffi et al. (2018) to larger radii we followed the thermal and chemical evolution of the outskirt gas as it is accreted and heated by the central cluster.
 |
Fig. 10. Comparison of the gas properties (average radial velocity, left; metallicity, middle; and temperature, right) at 2.0rvir for cluster 20. Contours are the same as in Fig. 1. |
Figure 11 shows the evolution tracks of gas particles that end up in the outflowing component of the cluster at the last snapshot (z = 0.25) with regard to total metallicity (left panel) and O/Fe ratio (right panel). Here O/Fe is defined as ![Mathematical equation: $ [\mathrm{O/Fe}]=\log\left(\frac{m_{\mathrm{O}}}{m_{\mathrm{Fe}}}\right)-{\log\left(\frac{m_{\mathrm{O}}}{m_{\mathrm{Fe}}}\right)}_\odot $](/articles/aa/full_html/2025/09/aa54804-25/aa54804-25-eq19.gif) , using again the mass fraction from (Wiersma et al. 2009). Particles were selected from three radial Fig. 3 (1000 particles per bin) within 1rvir, between 2rvir and 3rvir and between 3rvir and 4rvir. The coloured tracks show the evolution of 40 randomly selected particles from the outermost bin with blue indicating a cold particle temperature and red a hot temperature. Both panels demonstrate enrichment in the outflowing component to happen primarily early on, while the particles are infalling or in the halo centre before they are heated. Essentially all vertical movement in the left panel (increasing overall metallicity) occurs before t ≈ 6 Gyr and critically also before the particles are heated. Once the infalling particles are heated to the virial temperature, no new stars are formed in their surroundings as they become part of the diffuse cluster atmosphere, stopping also the influx of metals. This is also visible in the O/Fe ratio: Particles are first enriched by core-collapse supernovae, causing their oxygen mass to increase relative to their iron mass. At later times, type Ia supernovae decrease this ratio, but this process is eventually stopped once the particles are heated completely, leaving the particles stable at relatively high oxygen to iron ratios. A second population of particles, with a lower final oxygen to iron ratio can be seen in both panels. These particles are heated early on, remain at low metallicities and undergo almost no type Ia enrichment. Comparing the median lines at different radii, the difference between the enrichment processes in- and outside the virial surface become apparent: While the two radial regions in the outskirts are enriched early and settle on a high oxygen-to-iron ratio (see also Biffi et al. 2018), the gas particles inside the virial radius get enriched much later and do not reach the same O/Fe ratios due to metal influx predominantly from thermonuclear supernovae.
, using again the mass fraction from (Wiersma et al. 2009). Particles were selected from three radial Fig. 3 (1000 particles per bin) within 1rvir, between 2rvir and 3rvir and between 3rvir and 4rvir. The coloured tracks show the evolution of 40 randomly selected particles from the outermost bin with blue indicating a cold particle temperature and red a hot temperature. Both panels demonstrate enrichment in the outflowing component to happen primarily early on, while the particles are infalling or in the halo centre before they are heated. Essentially all vertical movement in the left panel (increasing overall metallicity) occurs before t ≈ 6 Gyr and critically also before the particles are heated. Once the infalling particles are heated to the virial temperature, no new stars are formed in their surroundings as they become part of the diffuse cluster atmosphere, stopping also the influx of metals. This is also visible in the O/Fe ratio: Particles are first enriched by core-collapse supernovae, causing their oxygen mass to increase relative to their iron mass. At later times, type Ia supernovae decrease this ratio, but this process is eventually stopped once the particles are heated completely, leaving the particles stable at relatively high oxygen to iron ratios. A second population of particles, with a lower final oxygen to iron ratio can be seen in both panels. These particles are heated early on, remain at low metallicities and undergo almost no type Ia enrichment. Comparing the median lines at different radii, the difference between the enrichment processes in- and outside the virial surface become apparent: While the two radial regions in the outskirts are enriched early and settle on a high oxygen-to-iron ratio (see also Biffi et al. 2018), the gas particles inside the virial radius get enriched much later and do not reach the same O/Fe ratios due to metal influx predominantly from thermonuclear supernovae.
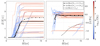 |
Fig. 11. Evolution tracks of 40 individual particles in overall metallicity (left panel) and O/Fe ratio (right panel). Particles were selected randomly between 3rvir and 4rvir with a radial peculiar velocity exceeding 100 km/s (outflowing) and a final metal mass exceeding mZ/mH = 10−4. The black lines show the medians of 1000 randomly selected particles, each for three different radial ranges. The line colour indicates the temperature of the particle at the given scale factor. |
The radial evolution of these particles is shown in Fig. 12. It demonstrates a similar radial origin for the outflowing components at 3rvir to 4rvir. There are, however, particles that are also rapidly kicked to these extreme halo-centric distances despite originally being accreted to well within 1rvir (see the lowest trajectories in the Fig. 12). These particles are most likely ejected by the massive merger that cluster 20 undergoes at late times (Kimmig et al. 2023) and demonstrates how even processes that happen on relatively long time scales – such as cluster mergers – can influence the dynamics on very short timescales and induce large velocities. This is also a channel through which halo-internal processes can directly influence the dynamics in the peripheral environments of these massive clusters and as such is an interesting subject for future work on dynamically very active cluster or supercluster regions.
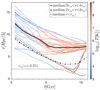 |
Fig. 12. Evolution tracks of the same 40 particles as in ztrack in radial distance to the cluster centre. The black lines again show the medians of 1000 randomly selected particles, each for three different radial ranges. The line colour indicates the temperature of the particle at the given scale factor. |
To compound the information from the purely outflowing component, Fig. 13 shows the metallicity–temperature phase space for all particles in the outskirt of cluster 20 between 1.2rvir and 3.0rvir (using the final rvir at z = 0.25) for different redshifts with blue indicating inflowing and red indicating outflowing particles. There is a clear temperature split between the hot and cold component of outskirt gas. In overall metallicity, the hot outflowing gas is slightly more spread out than the more pristine inflowing gas. (see also: Fig. 11). In the O/Fe-T plane the outflowing gas is distributed almost identically to the inflowing component, providing further evidence that the chemical evolution is largely stopped after infall. We note that in this cluster, which assembles rather late in time, none of the outskirt gas particles from z = 0 show significant metal enrichment at z = 4. We find that the evolution of the cluster gas elemental abundances starts out at high-redshift being strongly alpha enhanced, matching expectations also for the elements in the stars (Kimmig et al. 2025). As time passes, however, the gas is quickly enriched by SN Ia, strongly reducing [O/Fe] while also increasing [Z], especially within the hot gas phase. This is consistent with cluster 20 lacking a massive protocluster progenitor at z = 4. Clusters with high Mvir > 1013 M⊙ in contrast, can already host a hot and metal enriched atmosphere, as shown by Remus et al. (2023).
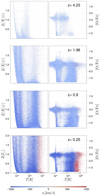 |
Fig. 13. Particle temperature versus metallicity (left column) and oxygen/iron ratio (right column) evolution with redshift. Inflowing particles are shown in blue, while outflowing particles are shown in red. |
In summary this study of cluster 20 largely confirms the standard picture of cluster accretion, with the gas infalling through dense and relatively cold filaments, enriching on infall and then being heated at the shock surface or below. Figure 11 clearly shows the chemical development being frozen in after the infalling phase and the subsequent heating is complete, with the final enrichment being dependent on the conditions during infall. We now test these findings across the whole mass sample to verify whether they generalise and are valid across the halo mass range probed in this study or if they might break down at the low-mass end, where the dynamics are more dominated by feedback.
6. Global phase properties of the flowing gas
We now extend the investigation of the thermal and chemical properties to the whole sample to verify consistency with the findings of the previous section and to analyse the mass scaling behaviour of these properties.
6.1. Temperature
Figure 14 depicts the mean temperature of the gas present in the halo outskirts for the full halo sample split into in- and outflowing gas (blue and red violins). The red and blue curves indicate the median of the respective mass bin. While Fig. 3 considered the total particle-based flow, as explained in Sect. 2.6, here only pixels with a net in- or outflow are considered for the blue and red curves, respectively. The linearity of the red and blue median curves in Fig. 14–inflow and outflow respectively–demonstrates a clear mass-scaling behaviour of the gas temperature close to the virial radius. However, there is a gap between the two curves that increases with radius and is more pronounced at the high-mass end. Notably, and inversely to the behaviour of the mass flow shown in Fig. 3, for the temperature it is the inflowing component that drops away from the mass-scaling relation at ≈1014 M⊙ for radii > 1.2rvir, showing a downwards kink.
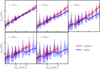 |
Fig. 14. Temperature of net inflow and outflow as a function of mass at five radii for the full halo sample. The spread of each bin is indicated by the red and blue vertical distributions. The cutoff at 1014 M⊙ for r ≥ 4.0rvir stems from the fact that there are no pixels with net outflow at this scale and does not indicate zero outflow or zero temperature. |
The outflow (red curve), in contrast, remains stable and linear out to large radii only decreasing slightly in temperature and showing a radial cut-off at large masses, where the outflows do not reach as far out in terms of scaled distance. This discrepancy in temperature can also be seen spatially in the right panel of Fig. 10, exemplary for cluster 20: The regions with a dense net in-flow that dominate the overall mass inflow – effectively the filaments – are significantly colder than the regions dominated by the thermally driven outflow. This is a direct manifestation of the shocks discussed in chapter 4. For the clusters of Box2b/hr and the high-mass group end, the gas falls in at a relatively cold temperature and is then heated when it encounters the pressure supported halo atmosphere. For the less massive haloes in both boxes however, the inflow and outflow are nearly in temperature equilibrium. This is possibly a manifestation of the mass hierarchy in the two different boxes: Less massive haloes (relative to the maximal halo mass in each box) tend to live in more active environments even when they have not yet been accreted by more massive haloes because there are more equal or higher mass haloes available in their vicinity to heat the surrounding gas. So the apparent drop-off of the inflow temperature at the high-mass end of the boxes should rather be thought of as a relative enhancement of inflow temperature for lower-mass haloes, responsible for the downwards kink in the mass-scaling relation.
6.2. Metallicity
Figure 15 shows the mean metallicity of the gas present in the outskirts of the sample split by flow direction. Compared to the clear mass scaling of the temperature curves, the metallicity inflow curves with respect to mass in Fig. 15 are relatively flat, indicating that the filaments and inflows in general are scale-independent in their chemical evolution. Notable is also a distinct lack of radial evolution, except for the fact that for the inner radial Fig. 3, there is a slight increase in metallicity for the massive clusters with decreasing radius. This effect is the strongest for the mass bin centred at 2 × 10¹⁴ M⊙. Generally inflows are less metal-rich than outflows, as one would expect. The red outflowing curve has a similar shape to the inflow at small radii. It shows an overall stronger enrichment than the inflowing gas. This is consistent with the picture established in Sec:Shocks for the individual cluster study: As gas falls onto massive clusters, it is pre-enriched by the evolving galaxies and groups infalling within the filaments and this evolution stops once the material encounters the shocks surface and is heated. The slight increase in inflowing metallicity with decreasing radius in the high-mass bins also fits into this picture since the gas evolves in metallicity as it falls closer to the central halo. This can also be seen in the tracks in Fig. 11 in combination with Fig. 12.
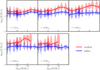 |
Fig. 15. Metallicity of the net (mean) inflow and outflow as a function of mass at five radii for the full halo sample. As in Fig. 14, the spread within each mass bin is indicated by the vertical distributions. As in Fig. 14 the cut-off in the high-mass–large radius range does not indicate zero metallicity. |
However, in contrast to the inflowing material, the outflows increase in metallicity going outwards from the central halo for the clusters (mass bins around 1014 M⊙). The increase in metallicity in the outflow for the highest mass bin is possibly a contamination effect of massive neighbours of these clusters contributing to the outflow with their own accretion (dominating the mass averages due to the inflows being more dense overall). The metallicity curves in Fig. 15 show a stronger offset relative to the vertical scatter within the bins between outflowing and infalling material when compared to the temperature in bins3. There additionally is, similarly to the temperature, a noticeable discontinuity in metallicity between the two simulations at the mass bin where they overlap at 1013 M⊙. Present in both components at small radii, this jump vanishes further out. While Box2b/hr and Box4/uhr differ in their global star formation and thus in their enrichment properties due to their different resolutions, the “floor” of enrichment is the same for both boxes in the relatively pristine and low density regime of the furthest halo outskirts. At around 0.1 Z⊙, most enriched gas particles have only been impacted by one to a few supernovae during their evolution independently of the resolution, explaining the agreement between the boxes at large radii. In the outflowing component there is a stronger residual resolution gap, consistent with the picture of the outflowing gas at large radii being the gas that is enriched and pushed out during the early formation of the central galaxy, where the resolution would indeed impact the efficiency of star formation and hence enrichment. The top panel of Fig. 16 shows the radial oxygen-to-iron ratio profiles for all haloes in the sample. The profiles are consistently flat across the entire mass range and are in agreement with previous numerical (Biffi et al. 2017; Vogelsberger et al. 2018; Angelinelli et al. 2022) and observational (Sakuma et al. 2011) studies on the inner regions of the ICM. There is, however, an apparent overall mass trend, with higher mass haloes having lower oxygen to iron ratios at each radius. This trend is likely caused by the difference in resolution between Box4/uhr and Box2b/hr as the red median lines calculated with the 1013 M⊙ bin in both boxes indicate. Previous works have examined differences in the cosmological star formation rates and their histories between the resolution levels (e.g. Dolag et al. 2025) and these differences will plausibly also impact the chemical composition of the gas, especially the O/Fe ratio, which is directly sensitive to the timescales of star formation in the cosmological volume. The overall metallicity in the bottom panel of Fig. 16 demonstrates a global trend of similar consistency across the mass range. There is a slight negative metallicity gradient for all haloes evening out eventually as the chemical influence of the central halo vanishes at large radii. (4rvir < r < 5rvir). Overall these findings (flat O/Fe ratio, slightly negative radial metallicity gradient and increased temperature for the outflowing component) are consistent with the early enrichment and subsequently frozen-in chemical evolution in the outskirt gas found for cluster 20. To complete the picture from the individual cluster study, it is also necessary to consider the temporal evolution of the scaling relations from Fig. 14 and Fig. 15, which we discuss in the following section.
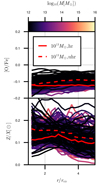 |
Fig. 16. Stacked radial O/Fe (top) and total metallicity (bottom) profiles with the same mass colouring as in Fig. 8. All haloes from all bins are used. |
6.3. Redshift evolution of temperature and metallicity
Figure 17 shows the evolution of the halo mass–gas temperature (upper panels) and halo mass–gas metallicity (lower panels) relation close to the virial surface and further in the outskirts. The temperature close to the virial surface decreases consistently across the mass range with time, keeping the mass scaling stable. This is still consistent with haloes and in consequence halo outskirts heating dynamically as they gain mass through mergers and accretion: As we considered equal-mass bins in time as opposed to tracing individual haloes, growing haloes will move from one bin to another in time and in consequence up the temperature mass relationship. The cooling trend in the temperature-mass relation rather reflect an overall cooling of the immediate surroundings of these objects as they evolve and accrete mass. In contrast, there is no clear time evolution of the mass-temperature scaling relationship at larger radii, which could plausibly be erased by the many factors that the temperature of the larger-scale environments of these objects depends on.
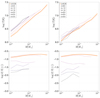 |
Fig. 17. Redshift evolution of the temperature and metallicity at 1.2rvir (left column) and 2.0rvir (right column) as a function of mass. The bin masses are identical to the ones used in the previous section. |
The metallicity evolution (lower panels) shows the picture of early enrichment and subsequent stagnation of the chemical evolution in the outskirt gas to be consistent across the mass range: At both sampled radii the normalisation of the metallicity-mass relation only significantly changes at z > 1.0. At later times the previously demonstrated flat mass-metallicity curve stabilises, showing little variation due to the enrichment in the outskirts having predominantly taken place at early times.
7. Conclusions
We have used the Magneticum suite of simulations to examine large-scale matter flows in the outskirts of haloes spanning a large range of masses and to study the mass scaling behaviour of these flows. This allowed us to determine how self-similar the accretion and outflow processes are across the entire range of masses. The main findings of this work are asfollows:
-
While the individual spatial flow configurations are complex and vary strongly from halo to halo, the average inflows onto haloes in the simulation follow a mass scaling relation that is consistent with the semi-analytical model for a hierarchically accreting overdensity and that is stable in time. This is important because it implies that inputs for mass-accretion models that do not emphasise the exact configuration of the flow fields (e.g. the Bathtub model for the balance of mass accretion and star formation Dekel et al. 2013) can be kept relatively simple and consistent across scales.
-
Considering the azimuthal symmetry of the inflow and outflow fields separately, inflows demonstrate a significantly less isotropic distribution when compared to outflows. This is consistent at all scales, though the isotropy of outflows at small scales is possibly overstated due to the feedback model used in the simulations not implementing kinetic feedback, which might introduce additional anisotropy at these scales. These findings confirm the expectations of inflows being largely filamentary due to coupling to the large-scale cosmic web, where the tidal configuration aids the pre-collapse of these elongated structures. The consistency of this inflow anisotropy confirms this to also be true for smaller haloes, which are fed by smaller sub-filaments given by the fractality of the cosmic web itself.
-
The thermal effects break the self-similar mass scaling of the flow fields for the outflowing component. The stronger impact of AGN feedback on galaxy to group size haloes can be seen as a characteristic kink in the mass scaling relation, as low-mass haloes show relatively stronger outflows at larger radii (r > 3rvir), thus extending previously found trends in simulations for clusters and groups in the mass scaling of the closure radius across an even larger mass range (Angelinelli et al. 2023).
-
In the Magneticum simulations, galaxy and group-mass objects have flat entropy profiles that remain flat to large radii, as the gas is mainly heated by the feedback processes. In contrast, cluster-mass objects show entropy peaks that reach out to ≈2 − 3rvir, which is consistent with expectations for MA-shocks (Zhang et al. 2020) in the outskirts of clusters that have undergone a massive merger recently. We report a decrease of entropy peak radius with mass for the objects that do have a significant entropy peak, consistent with previous work.
-
The metals present in the outskirts of the example cluster we studied in detail are predominantly formed during gas infall and before the gas encounters the shock surface and thermalises its kinetic energy, confirming the early enrichment scenario (Biffi et al. 2018). Both the total metallicity and the O/Fe mass ratio, as a proxy for the enrichment history, effectively stop evolving once the gas joins the hot expanding atmosphere in the cluster outskirts.
-
The temperature in the cluster outskirts shows a consistent mass scaling behaviour of mass increasing with temperature, and the outflows are consistently hotter than the cold inflowing gas due to shock heating and AGN feedback.
-
The degree of enrichment in galaxy clusters and galaxy outskirts is very similar, with no clear mass scaling behaviour. Overall, the outflowing component demonstrates a higher degree of enrichment compared to the inflow, and the radial profiles are consistent with the ones found in previous work. However, we report a peculiar increase of the metallicity of outflowing gas for cluster haloes in the intermediate to large radial range (2 − 4rvir).
In summary we find the inflows at the virial surface of haloes to be largely self-similar in their global properties. This indicates that the CGM and the ICM couple to the large-scale environment in a similar manner when one considers the total inflow, which is dominated by the dense filamentary environment around haloes. This result verifies that in terms of the total inflow budget, relatively simple accretion models (e.g. Dekel et al. 2009) provide enough accuracy.
Deviations from self-similarity arise in the relatively isotropic outflowing component where the different mechanisms of gas heating create significant discrepancies between the galaxy cluster and the galaxy outskirts. The large extent of the shock radius for galaxy mass haloes significantly changes the infall structure for these objects, as the isotropic outflow component displaces isotropic inflows from the environment out to much larger radii. This can be expected to impact galaxy formation on much smaller scales, as previous studies have shown that the connection of a galaxy to its environment can prolong its star formation activity (Galárraga-Espinosa et al. 2023). While the exact extent of the outflows is sensitive to the feedback implementation, we can expect the total balance of outflow energy to be relatively robust.
Similarly, the extended merger-driven accretion shocks we find in the outskirts of massive clusters can affect the dynamical mass estimates of these structures. It has been shown that whether a cluster outskirt region is inflowing or outflowing significantly impacts the dynamical state of the gas in that region (Lebeau et al. 2024a,b). In light of future detailed surveys of the gaseous outer regions of structures, these differences between galaxy mass and cluster mass objects can help improve the theoretical modelling of gas physics and interpret observational results.
The number 29 was motivated by the 29 most massive clusters from the high-resolution box (Box2b/hr) as these are the haloes with mass Mvir > 1015 M⊙, see Kimmig et al. (2023) for further details.
αi is calculated with the ratio of the particles’ smoothing length overlapping with the pixel  . Here hsmlproj is the projected smoothing length of the particle given by
  , with dr being the particles radial distance to the pixel center.
Acknowledgments
We thank the anonymous referee for their useful comments that helped improve the paper. BAS acknowledges support by the grant agreements ANR-21-CE31-0019/490702358 from the French Agence Nationale de la Recherche/Deutsche Forschungsgemeinschaft, DFG through the LOCALIZATION project. The Magneticum simulations were performed at the Leibniz-Rechenzentrum with CPU time assigned to the Project pr83li. this work was supported by the DFG under Germany’s Excellence Strategy EXC-2094 – 390783311. We are especially grateful for the support by M. Petkova through the Computational Center for Particle and Astrophysics (C2PAP). LMV acknowledges support by the German Academic Scholarship Foundation (Studienstiftung des deutschen Volkes) and the Marianne-Plehn-Program of the Elite Network of Bavaria. LCK acknowledges support by the DFG project nr. 516355818. KD acknowledges support by the COMPLEX project from the European Research Council (ERC) under the European Union’s Horizon 2020 research and innovation program grant agreement ERC-2019-AdG 882679.
References
- Andreon, S. 2010, MNRAS, 407, 263 [NASA ADS] [CrossRef] [Google Scholar]
- Angelinelli, M., Ettori, S., Dolag, K., Vazza, F., & Ragagnin, A. 2022, A&A, 663, L6 [NASA ADS] [CrossRef] [EDP Sciences] [Google Scholar]
- Angelinelli, M., Ettori, S., Dolag, K., Vazza, F., & Ragagnin, A. 2023, A&A, 675, A188 [NASA ADS] [CrossRef] [EDP Sciences] [Google Scholar]
- Beck, A. M., Murante, G., Arth, A., et al. 2016, MNRAS, 455, 2110 [Google Scholar]
- Biffi, V., Planelles, S., Borgani, S., et al. 2017, MNRAS, 468, 531 [Google Scholar]
- Biffi, V., Planelles, S., Borgani, S., et al. 2018, MNRAS, 476, 2689 [Google Scholar]
- Bogdán, Á., Khabibullin, I., Kovács, O. E., et al. 2023, ApJ, 953, 42 [CrossRef] [Google Scholar]
- Carroll, S. M., Press, W. H., & Turner, E. L. 1992, A&ARv, 30, 499 [Google Scholar]
- Castignani, G., Vulcani, B., Finn, R. A., et al. 2022, ApJS, 259, 43 [NASA ADS] [CrossRef] [Google Scholar]
- Churazov, E., Khabibullin, I. I., Dolag, K., Lyskova, N., & Sunyaev, R. A. 2023, MNRAS, 523, 1209 [NASA ADS] [CrossRef] [Google Scholar]
- de Plaa, J., Werner, N., Bleeker, J. A. M., et al. 2007, A&A, 465, 345 [NASA ADS] [CrossRef] [EDP Sciences] [Google Scholar]
- Dekel, A., & Birnboim, Y. 2006, MNRAS, 368, 2 [NASA ADS] [CrossRef] [Google Scholar]
- Dekel, A., Birnboim, Y., Engel, G., et al. 2009, Nature, 457, 451 [Google Scholar]
- Dekel, A., Zolotov, A., Tweed, D., et al. 2013, MNRAS, 435, 999 [Google Scholar]
- Dolag, K., Jubelgas, M., Springel, V., Borgani, S., & Rasia, E. 2004, ApJ, 606, L97 [NASA ADS] [CrossRef] [Google Scholar]
- Dolag, K., Vazza, F., Brunetti, G., & Tormen, G. 2005a, MNRAS, 364, 753 [NASA ADS] [CrossRef] [Google Scholar]
- Dolag, K., Hansen, F. K., Roncarelli, M., & Moscardini, L. 2005b, MNRAS, 363, 29 [Google Scholar]
- Dolag, K., Borgani, S., Murante, G., & Springel, V. 2009, MNRAS, 399, 497 [Google Scholar]
- Dolag, K., Remus, R.-S., Valenzuela, L. M., et al. 2025, A&A, submitted [arXiv:2504.01061] [Google Scholar]
- Fabjan, D., Borgani, S., Tornatore, L., et al. 2010, MNRAS, 401, 1670 [Google Scholar]
- Fortuné, S., Remus, R.-S., Kimmig, L. C., Burkert, A., & Dolag, K. 2025, A&A, submitted [arXiv:2503.20858] [Google Scholar]
- Gaite, J. 2019, Adv. Astron., 2019, e6587138 [Google Scholar]
- Galárraga-Espinosa, D., Garaldi, E., & Kauffmann, G. 2023, A&A, 671, A160 [NASA ADS] [CrossRef] [EDP Sciences] [Google Scholar]
- Gatkine, P., Veilleux, S., & Cucchiara, A. 2019, ApJ, 884, 66 [NASA ADS] [CrossRef] [Google Scholar]
- Gatuzz, E., Mohapatra, R., Federrath, C., et al. 2023, MNRAS, 524, 2945 [NASA ADS] [CrossRef] [Google Scholar]
- Gorski, K. M., Hivon, E., Banday, A. J., et al. 2005, ApJ, 622, 759 [Google Scholar]
- Gouin, C., Gallo, S., & Aghanim, N. 2022, A&A, 664, A198 [NASA ADS] [CrossRef] [EDP Sciences] [Google Scholar]
- Harris, W. E., Remus, R.-S., Harris, G. L. H., & Babyk, I. V. 2020, ApJ, 905, 28 [CrossRef] [Google Scholar]
- Hidding, J., Shandarin, S. F., & van de Weygaert, R. 2014, MNRAS, 437, 3442 [Google Scholar]
- Hirschmann, M., Dolag, K., Saro, A., et al. 2014, MNRAS, 442, 2304 [Google Scholar]
- Hogarth, L. M., Saintonge, A., Cortese, L., et al. 2021, MNRAS, 500, 3802 [Google Scholar]
- Kimmig, L. C., Remus, R.-S., Dolag, K., & Biffi, V. 2023, ApJ, 949, 92 [Google Scholar]
- Kimmig, L. C., Remus, R.-S., Seidel, B., et al. 2025, ApJ, 979, 15 [Google Scholar]
- Kobayashi, C., Karakas, A. I., & Lugaro, M. 2020, ApJ, 900, 179 [Google Scholar]
- Komatsu, E., Smith, K. M., Dunkley, J., et al. 2011, ApJS, 192, 18 [Google Scholar]
- Lebeau, T., Sorce, J. G., Aghanim, N., Hernández-Martínez, E., & Dolag, K. 2024a, A&A, 682, A157 [NASA ADS] [CrossRef] [EDP Sciences] [Google Scholar]
- Lebeau, T., Ettori, S., Aghanim, N., & Sorce, J. G. 2024b, A&A, 689, A19 [NASA ADS] [CrossRef] [EDP Sciences] [Google Scholar]
- Libeskind, N. I., Knebe, A., Hoffman, Y., et al. 2011, MNRAS, 411, 1525 [NASA ADS] [CrossRef] [Google Scholar]
- Loewenstein, M. 2006, ApJ, 648, 230 [Google Scholar]
- Lotz, M., Remus, R.-S., Dolag, K., Biviano, A., & Burkert, A. 2019, MNRAS, 488, 5370 [NASA ADS] [CrossRef] [Google Scholar]
- Lotz, M., Dolag, K., Remus, R.-S., & Burkert, A. 2021, MNRAS, 506, 4516 [NASA ADS] [CrossRef] [Google Scholar]
- Murante, G., Calabrese, M., De Lucia, G., et al. 2012, ApJ, 749, L34 [Google Scholar]
- Navarro, J. F., Frenk, C. S., & White, S. D. M. 1997, ApJ, 490, 493 [Google Scholar]
- Nomoto, K., Kobayashi, C., & Tominaga, N. 2013, A&ARv, 51, 457 [Google Scholar]
- Papovich, C., Kawinwanichakij, L., Quadri, R. F., et al. 2018, ApJ, 854, 30 [NASA ADS] [CrossRef] [Google Scholar]
- Press, W. H., & Schechter, P. 1974, ApJ, 187, 425 [Google Scholar]
- Ragagnin, A., Andreon, S., & Puddu, E. 2022, A&A, 666, A22 [NASA ADS] [CrossRef] [EDP Sciences] [Google Scholar]
- Rees, M. J., & Ostriker, J. P. 1977, MNRAS, 179, 541 [NASA ADS] [CrossRef] [Google Scholar]
- Remus, R.-S., & Forbes, D. A. 2022, ApJ, 935, 37 [NASA ADS] [CrossRef] [Google Scholar]
- Remus, R.-S., Dolag, K., & Dannerbauer, H. 2023, ApJ, 950, 191 [NASA ADS] [CrossRef] [Google Scholar]
- Sakuma, E., Ota, N., Sato, K., Sato, T., & Matsushita, K. 2011, PASJ, 63, S979 [Google Scholar]
- Salvati, L., Douspis, M., Ritz, A., Aghanim, N., & Babul, A. 2019, A&A, 626, A27 [NASA ADS] [CrossRef] [EDP Sciences] [Google Scholar]
- Shi, X. 2016, MNRAS, 461, 1804 [NASA ADS] [CrossRef] [Google Scholar]
- Springel, V. 2005, MNRAS, 364, 1105 [Google Scholar]
- Springel, V., & Hernquist, L. 2003, MNRAS, 339, 289 [Google Scholar]
- Springel, V., White, S. D. M., Tormen, G., & Kauffmann, G. 2001, MNRAS, 328, 726 [Google Scholar]
- Springel, V., di Matteo, T., & Hernquist, L. 2005, MNRAS, 361, 776 [CrossRef] [Google Scholar]
- Stuber, S. K., Saito, T., Schinnerer, E., et al. 2021, A&A, 653, A172 [NASA ADS] [CrossRef] [EDP Sciences] [Google Scholar]
- Teklu, A. F., Remus, R.-S., Dolag, K., et al. 2015, ApJ, 812, 29 [Google Scholar]
- Tornatore, L., Borgani, S., Matteucci, F., Recchi, S., & Tozzi, P. 2004, MNRAS, 349, L19 [Google Scholar]
- Tornatore, L., Borgani, S., Dolag, K., & Matteucci, F. 2007, MNRAS, 382, 1050 [Google Scholar]
- Vallés-Pérez, D., Planelles, S., & Quilis, V. 2020, MNRAS, 499, 2303 [CrossRef] [Google Scholar]
- van den Bosch, F. C. 2002, MNRAS, 331, 98 [CrossRef] [Google Scholar]
- Vogelsberger, M., Marinacci, F., Torrey, P., et al. 2018, MNRAS, 474, 2073 [NASA ADS] [CrossRef] [Google Scholar]
- Walker, S., Simionescu, A., Nagai, D., et al. 2019, Space Sci. Rev., 215, 7 [Google Scholar]
- Watkins, E. J., Kreckel, K., Groves, B., et al. 2023, A&A, 676, A67 [NASA ADS] [CrossRef] [EDP Sciences] [Google Scholar]
- Wiersma, R. P. C., Schaye, J., & Smith, B. D. 2009, MNRAS, 393, 99 [NASA ADS] [CrossRef] [Google Scholar]
- Yu, B. P. B., Owen, E. R., Pan, K.-C., Wu, K., & Ferreras, I. 2021, MNRAS, 508, 5092 [NASA ADS] [CrossRef] [Google Scholar]
- Zel’dovich, Ya. B. 1970, A&A, 5, 84 [Google Scholar]
- Zhang, C., Churazov, E., Dolag, K., Forman, W. R., & Zhuravleva, I. 2020, MNRAS, 494, 4539 [NASA ADS] [CrossRef] [Google Scholar]
All Figures
|
Fig. 1. Four fields (density, radial velocity, temperature, and metallicity) interpolated on the spherical shells just outside the virial surface (r = 1.2rvir) shown for an exemplary cluster from the highest mass bin (1015 M⊙). The contours indicate the |
| In the text | |
|
Fig. 2. Exemplary total mass flow map generated with SMAC (Dolag et al. 2005b) for cluster 5 (left column) and cluster 20 (right column) in the sample. Red marks the outflow-dominated pixels, while the inflow-dominated pixels are blue. Contours again mark the overdensity at the 1-δ and the 8-δ level. (a) 1.2rvir. (b) 2.0rvir. (c) 3.0rvir. |
| In the text | |
|
Fig. 3. Comparison of the total inflow (black and blue lines for DM and gas respectively) and outflow (red line for gas only) in the Magneticum simulation and the van den Bosch (2002) model (dashed black lines, thin for the linearly extrapolated M0, nofit; bold for the fit M0, fit). The inflow component is decomposed into a DM accretion flow and a baryonic accretion flow using the baryon fraction and the Andreon (2010) model to compensate for the increasing stellar component at low masses. Additionally, we show the gas accretion model presented by Dekel et al. (2009) as the dark blue dotted line. All flows are shown at 1.2, 2, 3, 4, and 5 virial radii (different panels). |
| In the text | |
|
Fig. 4. Relative outflow strength (the outflow rate divided by the respective halo mass, |
| In the text | |
|
Fig. 5. Aspherical excess of the flows parametrised by the asphericity parameter ζ at 1.2rvir (left) and 2.0rvir (right) for the inflowing and outflowing components, respectively. The violins show the vertical distribution, while the black horizontal lines show the median for each bin. The bin present in both simulations (Box2b/hr and Box4/uhr) is plotted twice to indicate the transition in resolution. |
| In the text | |
|
Fig. 6. Redshift evolution of inflow, outflow, and net flow (inflow − outflow) at 1.2rvir (top row) and at 2.0rvir (bottom row). The bin masses (x-axis) are identical to the ones used in Fig. 3. The colours indicate the redshift of the curve. |
| In the text | |
|
Fig. 7. Entropy evolution of a 1.3 × 10¹⁵ M⊙ mass non-cool-core cluster, a 1.6 × 10¹⁵ M⊙ cool-core cluster, a 1.6 × 10¹³ M⊙ size group, and a 0.91 × 10¹² M⊙ halo, from left to right. The black circle indicates the virial radius of each object. The box lengths are scaled to ten times the virial radius for the clusters and 40 times the virial radius for the groups or galaxies with a slice thickness of 1 Mpc/h for all images. |
| In the text | |
|
Fig. 8. Absolute, left panel, and scaled (K(r)/K(rvir), right panel, radial entropy profiles for all haloes in the sample. The virial mass is indicated by the colour of the curve. |
| In the text | |
|
Fig. 9. Mass dependence of the radius of maximal entropy. The dots represent the individual haloes of the sample. The line shows a Linear fit in log-log space obtained from the haloes in the range where there is a clear entropy peak visible. The obtained parameters are t = 2.6193 ± 0.1157 and m = −0.1513 ± 0.0008 using a log(rmax(K)) = m × log(M/M⊙)+t model. The tight spacing of the dots along the x-axis reflects the mass spread of the Fig. 3, which we have optimised to be as small as possible (see Sec:Methods). |
| In the text | |
|
Fig. 10. Comparison of the gas properties (average radial velocity, left; metallicity, middle; and temperature, right) at 2.0rvir for cluster 20. Contours are the same as in Fig. 1. |
| In the text | |
|
Fig. 11. Evolution tracks of 40 individual particles in overall metallicity (left panel) and O/Fe ratio (right panel). Particles were selected randomly between 3rvir and 4rvir with a radial peculiar velocity exceeding 100 km/s (outflowing) and a final metal mass exceeding mZ/mH = 10−4. The black lines show the medians of 1000 randomly selected particles, each for three different radial ranges. The line colour indicates the temperature of the particle at the given scale factor. |
| In the text | |
|
Fig. 12. Evolution tracks of the same 40 particles as in ztrack in radial distance to the cluster centre. The black lines again show the medians of 1000 randomly selected particles, each for three different radial ranges. The line colour indicates the temperature of the particle at the given scale factor. |
| In the text | |
|
Fig. 13. Particle temperature versus metallicity (left column) and oxygen/iron ratio (right column) evolution with redshift. Inflowing particles are shown in blue, while outflowing particles are shown in red. |
| In the text | |
|
Fig. 14. Temperature of net inflow and outflow as a function of mass at five radii for the full halo sample. The spread of each bin is indicated by the red and blue vertical distributions. The cutoff at 1014 M⊙ for r ≥ 4.0rvir stems from the fact that there are no pixels with net outflow at this scale and does not indicate zero outflow or zero temperature. |
| In the text | |
|
Fig. 15. Metallicity of the net (mean) inflow and outflow as a function of mass at five radii for the full halo sample. As in Fig. 14, the spread within each mass bin is indicated by the vertical distributions. As in Fig. 14 the cut-off in the high-mass–large radius range does not indicate zero metallicity. |
| In the text | |
|
Fig. 16. Stacked radial O/Fe (top) and total metallicity (bottom) profiles with the same mass colouring as in Fig. 8. All haloes from all bins are used. |
| In the text | |
|
Fig. 17. Redshift evolution of the temperature and metallicity at 1.2rvir (left column) and 2.0rvir (right column) as a function of mass. The bin masses are identical to the ones used in the previous section. |
| In the text | |
Current usage metrics show cumulative count of Article Views (full-text article views including HTML views, PDF and ePub downloads, according to the available data) and Abstracts Views on Vision4Press platform.
Data correspond to usage on the plateform after 2015. The current usage metrics is available 48-96 hours after online publication and is updated daily on week days.
Initial download of the metrics may take a while.