Fig. 5.
Download original image
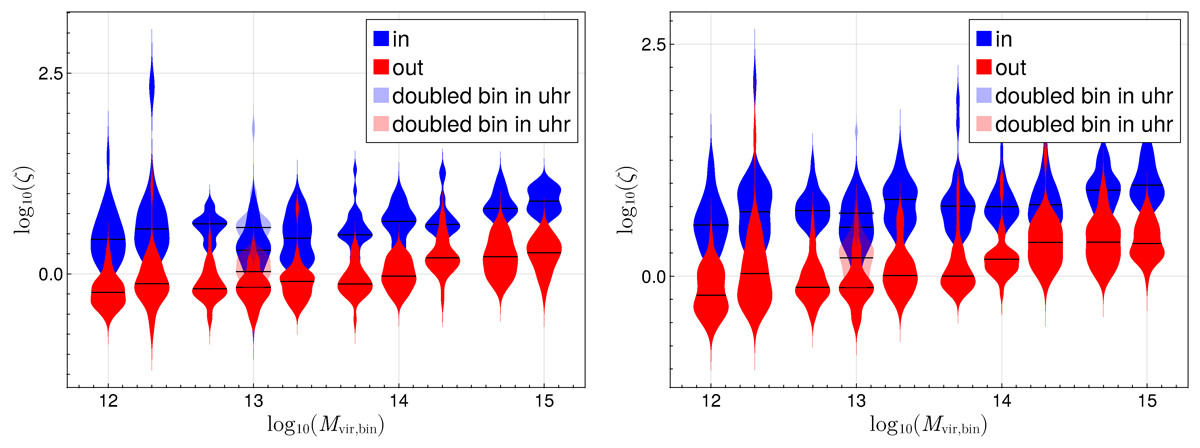
Aspherical excess of the flows parametrised by the asphericity parameter ζ at 1.2rvir (left) and 2.0rvir (right) for the inflowing and outflowing components, respectively. The violins show the vertical distribution, while the black horizontal lines show the median for each bin. The bin present in both simulations (Box2b/hr and Box4/uhr) is plotted twice to indicate the transition in resolution.
Current usage metrics show cumulative count of Article Views (full-text article views including HTML views, PDF and ePub downloads, according to the available data) and Abstracts Views on Vision4Press platform.
Data correspond to usage on the plateform after 2015. The current usage metrics is available 48-96 hours after online publication and is updated daily on week days.
Initial download of the metrics may take a while.