Open Access
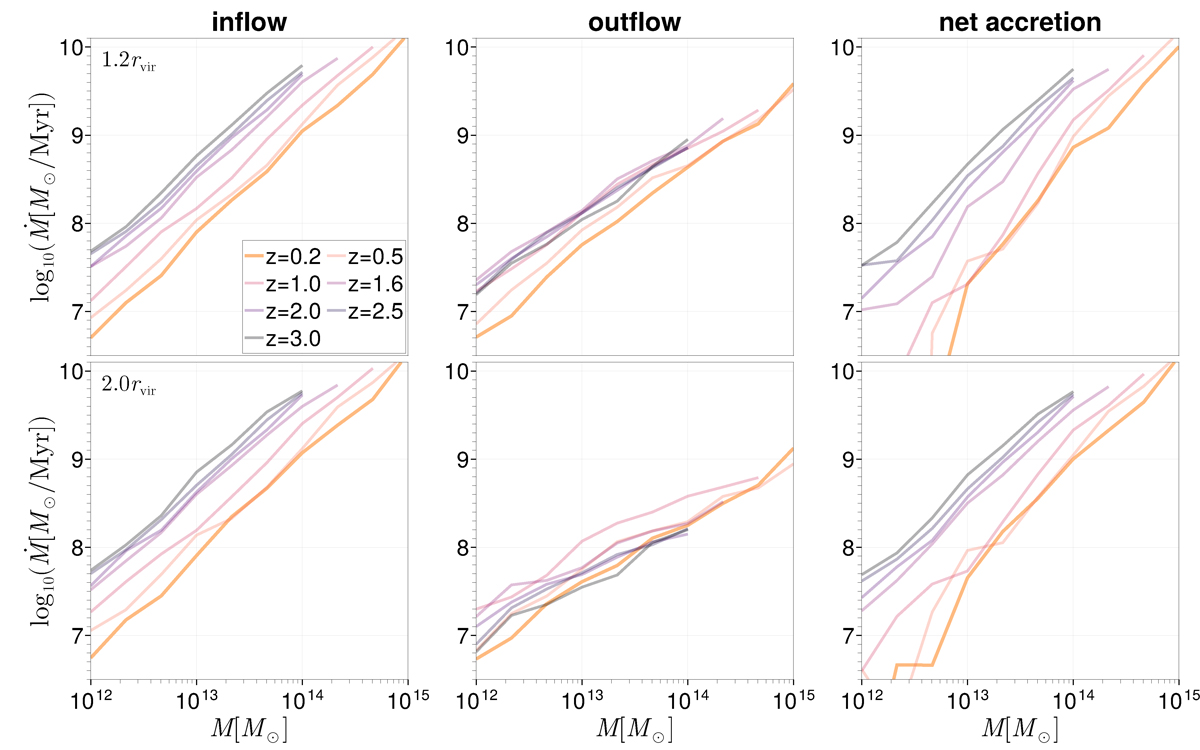
Fig. 6.
Download original image
Redshift evolution of inflow, outflow, and net flow (inflow − outflow) at 1.2rvir (top row) and at 2.0rvir (bottom row). The bin masses (x-axis) are identical to the ones used in Fig. 3. The colours indicate the redshift of the curve.
Current usage metrics show cumulative count of Article Views (full-text article views including HTML views, PDF and ePub downloads, according to the available data) and Abstracts Views on Vision4Press platform.
Data correspond to usage on the plateform after 2015. The current usage metrics is available 48-96 hours after online publication and is updated daily on week days.
Initial download of the metrics may take a while.